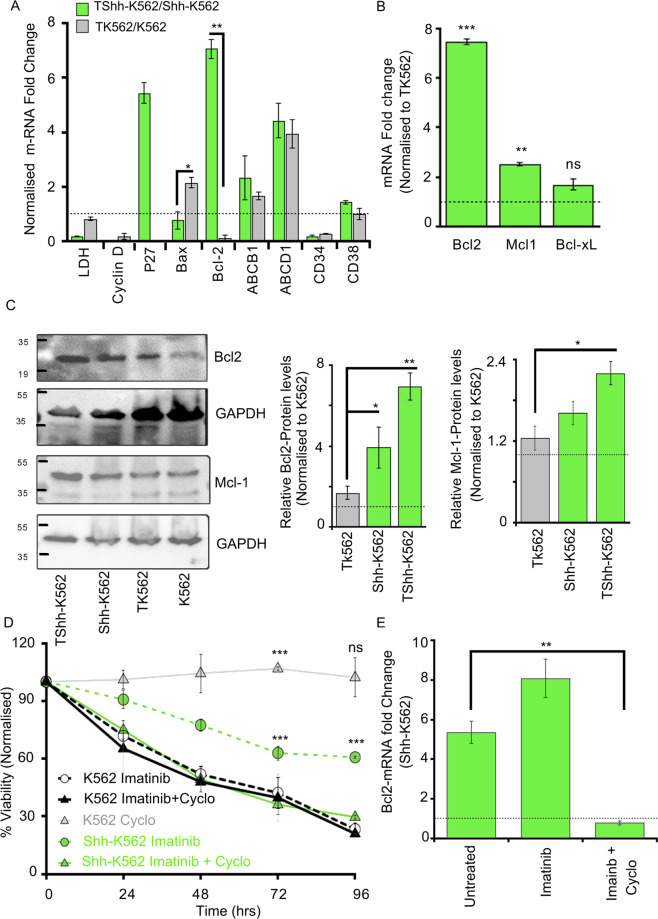
Fig. 3. Shh signaling imparts Imatinib resistance via Bcl2 upregulation.
A RT-PCR-based fold change determination in expression of various genes known for their role in drug resistance. Imatinib-treated Shh-K562 cells (TShh-K562) and treated K562 (TK562) normalized to their respective untreated controls, at 72 h. Bars represents mean ± SD from three biological repeats. B mRNA-fold change of three anti-apoptotic genes, Bcl2, Mcl-1, Bcl-xL, measured using RT-PCR in Imatinib-treated Shh-K562 (TShh-K562) normalized to Imatinib-treated K562 (TK562). Bars represents mean ± SD from two biological repeats. C Western blot representing expression of Bcl2 and Mcl-1 from untreated and Imatinib-treated cells (K562, Shh-K562, TK562, and TShh-K562). GAPDH is used as loading control. The graph represents densitometric analysis of relative protein levels normalized to untreated K562. Bar represents mean ± SD from three biological repeats. D Time-curve representing viability (MTT assay) of K562 (black dotted line) and Shh-K562 (green dotted line) cell lines after treatment with Imatinib (0.5 µM); K562 (black solid line) and Shh-K562 (green solid line) for Imatinib (0.5 µM) + Cyclopamine (25 nM) treated conditions; gray solid line represents viability of K562 after Cyclopamine treatment (25 nM). Graph represents mean ± SD from three biological repeats. E RT-PCR data determining the level of Bcl2-mRNA in K562 and Shh-K562 after treatment for 72 h with either vehicle control (untreated), Imatinib-alone, or Imatinib + Cyclopamine normalized to their respective K562 controls (black dotted line at 1). Bar represents mean ± SD from two biological repeats. For all assays, P values, *<0.05, **<0.01, and ***<0.001. Statistical analysis done using t-test.

