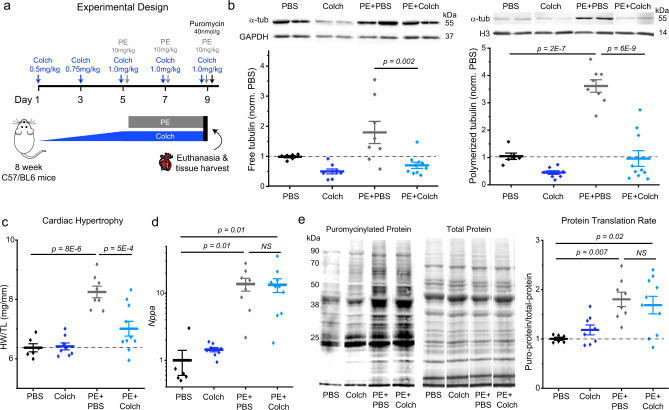
Fig. 1. Microtubule depolymerization uncouples increased protein translation from cardiac growth.
a Experimental design for PE-induced hypertrophy mouse model. b Representative western blot images of free α-tubulin and loading control GAPDH (top left) and quantification of normalized free tubulin from each group (bottom left). Representative western blot images of polymerized α-tubulin and loading control Histone H3 (top right) and quantification of normalized polymerized tubulin from each group (bottom right). c Quantification of cardiac hypertrophy. d Quantification of Nppa expression. e Representative western blots for puromycinylated proteins (left) and total protein (center). Quantification of translation rate (right). For all panels, statistical significance determined via one-way ANOVA with post hoc Bonferroni comparisons. For all panels, PBS (N = 6), Colch (N = 8), PE + PBS (N = 8), and PE + Colch (N = 10). For all graphs shown in figure, the mean line is shown, with whiskers denoting standard error (SE) from the mean. Source data are provided as a Source data file.

