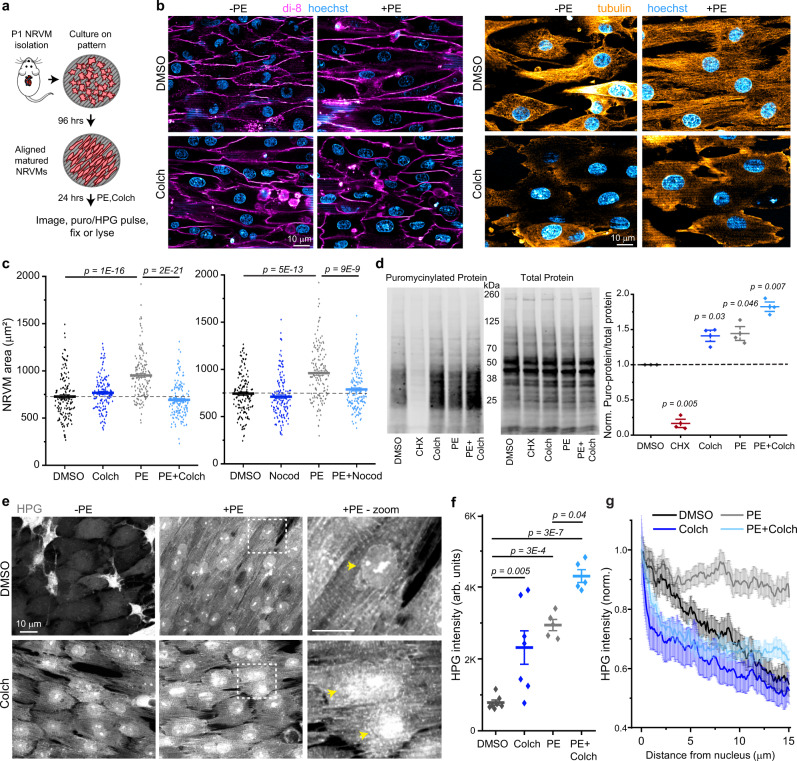
Fig. 2. Microtubule depolymerization leads to mislocalized translation.
a Experimental design of NRVM isolation, patterning, and experiments. b Representative live-cell (left) or immunofluorescence (right) images of NRVMs treated with DMSO, PE, Colch, or PE + Colch. c Quantification of cell areas in NRVMs treated with (left) DMSO (n = 147), PE (n = 148), Colch (n = 138), or PE + Colch (n = 143) and (right) in NRVMs treated with DMSO (n = 145), PE (n = 148), Nocod (n = 150), or PE + Nocod (n = 151). Statistical significance determined via one-way ANOVA with post hoc Bonferroni comparison, each treatment repeated in at least 3 independent NRVM litters. d Measurement of translational activity in NRVMs. Representative western blots labeled for puromycinylated proteins (left) and total protein (center). (right) Quantification of translation rate, normalized to DMSO. One-sample, two-tailed t-test vs. mean = 1, unadjusted p-value reported. e Representative fluorescence images of NRVMs treated with DMSO, PE, Colch, or PE + Colch. Yellow arrows indicate nuclei. f Quantification of HPG intensity. DMSO (n = 137 NRVMs), PE (n = 126), Colch (n = 132), or PE + Colch (n = 140), each data point represents pooled single-cell values from a field of view, statistical significance determined via one-way ANOVA with post hoc Bonferroni comparison. g Averaged line scans of HPG intensity. DMSO (n = 30 NRVMs), PE (n = 30), Colch (n = 30), or PE + Colch (n = 30). For all graphs shown in figure, the mean line is shown, with whiskers denoting standard error (SE) from the mean. Source data are provided as a Source data file.

