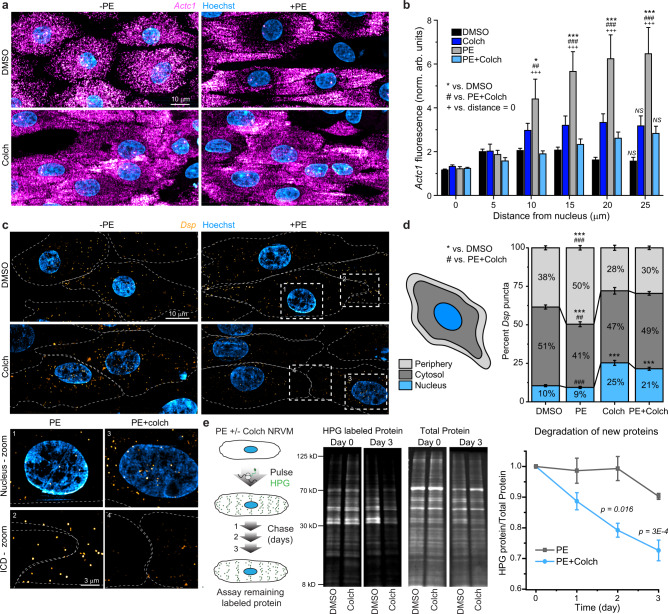
Fig. 3. Microtubule-dependent peripheralization of mRNA transcripts is concomitant with cardiac hypertrophy.
a Representative images of NRVMs treated with DMSO, PE, Colch, and PE + Colch and hybridized for Actc1 mRNA. b Quantitative line scan analysis of images from a. After normalization to the initial value, mean fluorescence intensities were binned every 5 µm from the center of the nucleus outward for each cell. DMSO (n = 96), PE (n = 85), Colch (n = 82), and PE + Colch (n = 103). Significance of PE group from either DMSO (*), PE + Colch (#) or initial PE measurement at distance = 0 (+) indicated by number of symbols, i.e., #p < 0.05, ##p < 0.01, and ###p < 0.001. Corresponding data points were omitted in overlay due to high n value and high variability, causing difficulty in visualization. c Representative images of NRVMs treated with DMSO, PE, Colch, and PE + Colch and hybridized for Dsp mRNA. Numbered insets show zoomed-in regions. d Quantification of c. DMSO (n = 82), PE (n = 88), Colch (n = 76), and PE + Colch (n = 87). Significance of PE group from either DMSO (*), PE + Colch (#) indicated by number of symbols, i.e., ##p < 0.01 and *** or ###p < 0.001. e (left) Experimental design for measurement of protein degradation rate using pulse HPG labeling. (middle) Representative western blots of HPG-labeled protein over time. (right) Quantification of relative remaining HPG over time. For all data in figure, statistical significance determined via two-way ANOVA with post hoc Bonferroni comparison, and data are from four independent NRVM litters. For all graphs shown in figure, whiskers denote standard error (SE) from the mean. Source data are provided as a Source data file.

