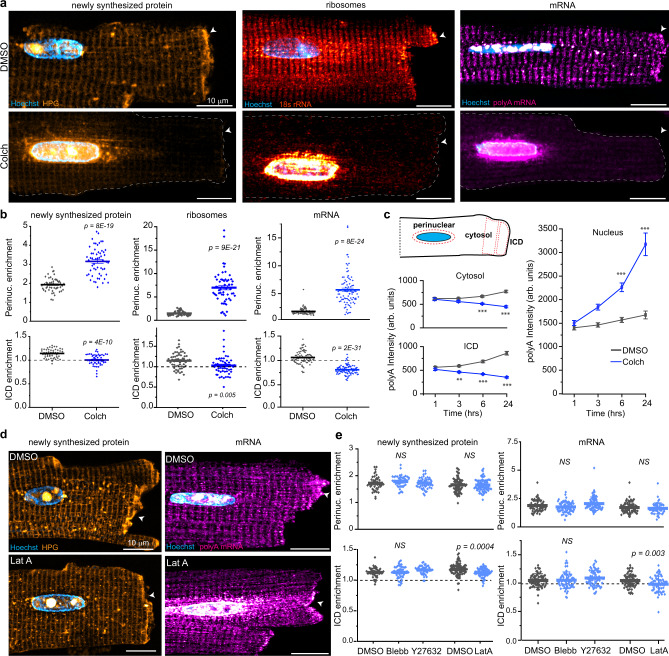
Fig. 4. Microtubules control the localization of mRNA, ribosomes, and new protein synthesis.
a Representative images of (left) newly synthesized protein, (middle) ribosomes and (right) mRNA in (top) DMSO or (bottom) Colch-treated ARVMs. White arrow indicates ICD. b Nuclear:cytosolic and ICD:cytosolic ratios of mean fluorescence intensities of experiments shown in a. Newly synthesized protein: DMSO (N = 3, n = 52), Colch (N = 3, n = 55); ribosomes: DMSO (N = 2, n = 54), Colch (N = 2, n = 57; mRNA: DMSO (N = 3, n = 82), Colch (N = 3, n = 90). Statistical significance determined via two sample, two-tailed t-test. c Cartoon (left, top) depicting representative placement of perinuclear, cytosolic, and ICD ROIs for analysis in b and c. Mean polyA fluorescence intensity in the cytosol (left, middle), ICD (left, bottom), and nucleus (right) as a function of time. DMSO, n = 47 (1 h), n = 51 (3 h), n = 54 (6 h), n = 40 (24 h). Colch, n = 49 (1 h), n = 47 (3 h), n = 50 (6 h), n = 47 (24 h). Statistical significance determined via one-way ANOVA with post hoc Bonferroni comparison. d Representative images of (left) newly synthesized protein and (right) mRNA in (top) DMSO or (bottom) Latrunculin A-treated ARVMs. White arrow indicates ICD. e Nuclear:cytosolic and ICD:cytosolic ratios of mean fluorescence intensities of experiments shown in d. Newly synthesized protein: DMSO (N = 2, n = 46), Blebb (N = 2, n = 49), Y27632 (N = 2, n = 48), DMSO (N = 3, n = 82), LatA (N = 3, n = 80); mRNA: DMSO (N = 3, n = 70), Blebb (N = 3, n = 63), Y27632 (N = 3, n = 74), and DMSO (N = 3, n = 77), LatA (N = 3, n = 59). Statistical significance determined via one-way ANOVA with post hoc Bonferroni comparision (DMSO, Blebb, Y27632) and two sample, two-tailed t-test (DMSO, LatA). For all graphs shown in figure, the mean line is shown, with whiskers denoting standard error (SE) from the mean. Source data are provided as a Source data file.

