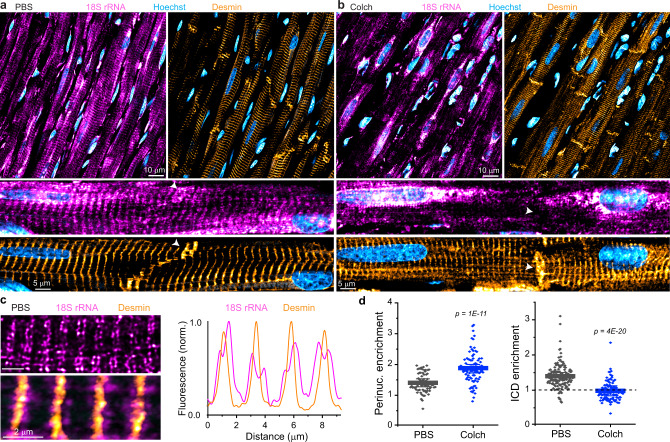
Fig. 5. Microtubules control the localization of ribosomes in vivo.
a Representative image of PBS-injected rat ventricular myocardium, with zoomed-in image below and white arrow highlighting ICD region. b Representative image of Colch-injected rat ventricular myocardium with similar zoom and highlight as in a. c (left) Zoomed-in image of PBS-injected rat ventricular myocardium. (right) Line scan analysis of the composite image shown at bottom left. d Nuclear:cytosolic and ICD:cytosolic ratios of 18S rRNA mean fluorescence intensities of experiment depicted in a and b. PBS (N = 2), (n = 71, N/C), (n = 137, ICD/C), Colch (N = 2), (n = 92, N/C), (n = 108, ICD/C). Statistical significance determined via two sample, two-tailed t-test. For all graphs shown in figure, the mean line is shown, with whiskers denoting standard error (SE) from the mean. Source data are provided as a Source data file.

