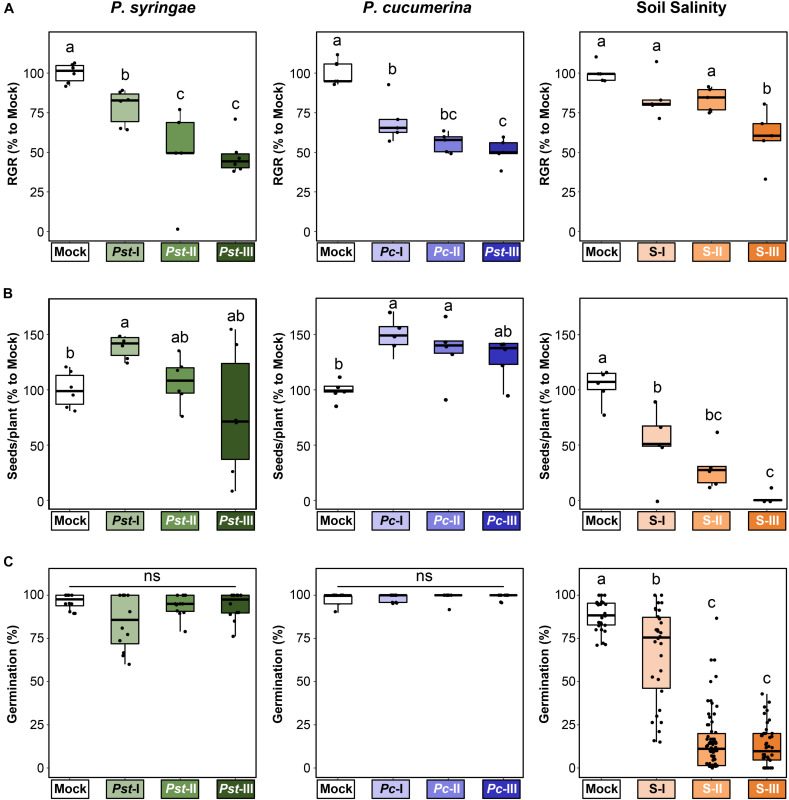
FIGURE 2.
Differential impacts of three (a)biotic stresses on parental fitness parameters. Plants in the parental generation (4.5 weeks old) were exposed to varying stress intensities by P. syringae pv tomato (Mock, Pst-I, Pst-II, and Pst-III), P. cucumerina (Mock, Pc-I, Pc-II, and Pc-III), or soil salinity (Mock, S-I, S-II, and S-III) over a 3-week period before transferring to long-day conditions to trigger flowering and set seed. Boxplots show the interquartile range (IQR; box) ± 1.5xIQR (whiskers), including median (horizontal line) and replication units (single dots). (A) Impacts on relative growth rate (RGR) during the period of stress exposure. Data represent RGR values of single plants (n = 5–6) normalized to the average RGR of Mock-treated plants (100%). Different letters indicate statistically significant differences (ANOVA + Tukey’s post hoc test, α = 0.05). (B) Impacts on seed production. Data represent seed numbers per plant (n = 5–6) normalized to average value of Mock-treated plants (100%). Different letters indicate statistically significant differences (Pst: Welch ANOVA + Games-Howell post hoc test, α = 0.05; Pc and salt: ANOVA + Tukey’s post hoc test, α = 0.05). (C) Impacts on seed viability. Seed viability was determined 5 days after planting of surface-sterilized and stratified seeds onto 0.2× Murashige and Skoog (MS) agar plates. Data represent mean germination percentages per plate (25 seeds/plate) of seed batches from four similarly treated parents (n = 15–60). Different letters indicate statistically significant differences (Welch ANOVA + Games-Howell post hoc test; α = 0.05). Viability data for seed batches from individual plants are presented in Supplementary Figures 1A–C.

