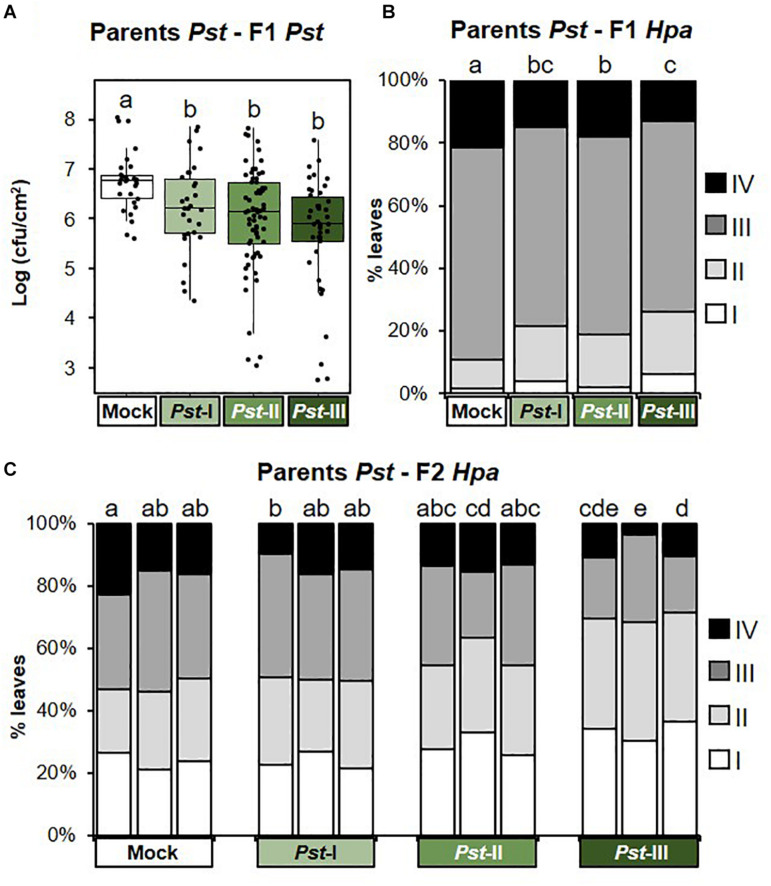
FIGURE 3.
Intensity and transgenerational stability of Pseudomonas syringae pv. tomato-mediated t-IR in matched environments. Parental plants had been exposed to different disease severities by the biotrophic bacterium Pseudomonas syringae pv. tomato (Pst; Mock, Pst-I, Pst-II, and Pst-III). F1 and F2 plants were analyzed for resistance against the same pathogen (Pst) and/or the biotrophic Oomycete Hyaloperonospora arabidopsidis (Hpa). (A) t-IR against Pst in F1 progeny at 3 dpi. Boxplots show the interquartile range (IQR; box) ± 1.5xIQR (whiskers), including median (horizontal line) and replication units (dots). Data represent 10log-transformed bacterial titers (log cfu/cm2) in leaves of single plants within F1 populations from similarly treated parents (n = 42). Different letters indicate statistically significant differences (Welch ANOVA + Games-Howell test, α = 0.05). Data for individual F1 populations are shown in Supplementary Figure 2A. (B) t-IR against Hpa in F1 progeny. Hpa colonization was quantified at 6 dpi by assigning trypan-blue stained leaves to four Hpa resistance classes (I, healthy; II, hyphal colonization only; III, hyphal colonization with conidiospores; and IV, hyphal colonization with conidiospores and oospores). Stacked bars show leaf frequency distributions within F1 populations from similarly treated parental plants (n = 600–1,000). Different letters indicate statistically significant differences (pairwise Fisher’s exact tests + Bonferroni FDR, α = 0.05). Data for individual F1 populations are shown in Supplementary Figure 2B. (C) t-IR against Hpa in F2 progeny at 6 dpi after one stress-free F1 generation. Stacked bars show leaf frequency distributions across Hpa resistance classes within F2 populations that share a common parental ancestor (n = 300–350). Different letters indicate statistically significant differences (pairwise Fisher’s exact tests + Bonferroni FDR; α = 0.05). Data for individual F2 populations are shown in Supplementary Figure 2C.

