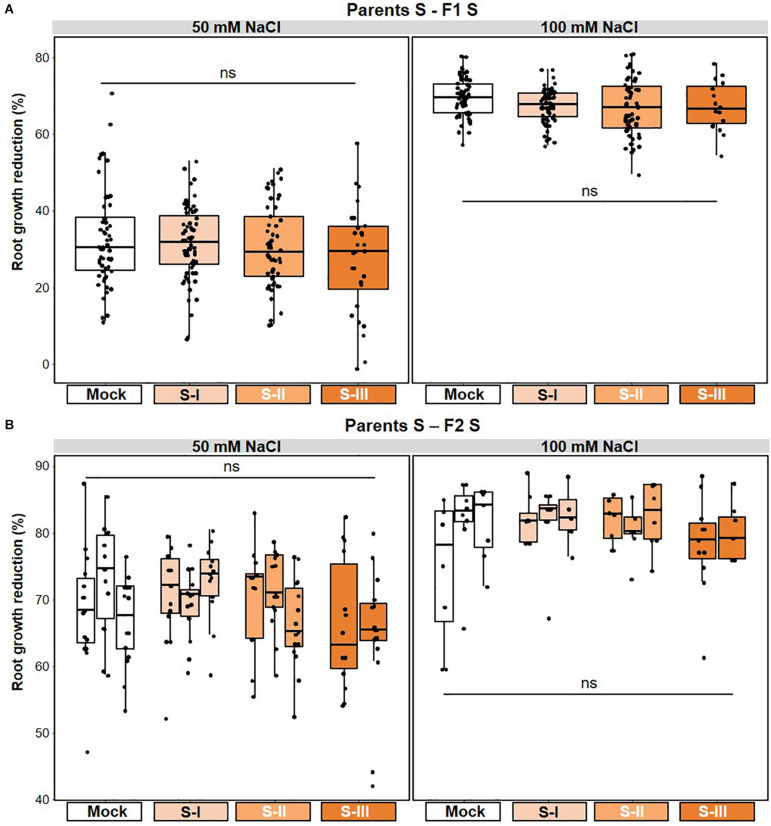
FIGURE 5.
Lack of salt-mediated t-IR in matched environments. Parental plants had been exposed to different stress intensities by soil salinity (NaCl; Mock, S-I, S-II, and S-III). Salt tolerance of F1 and F2 plants was quantified by root growth reduction (%) over a 5-day period on NaCl-containing agar medium relative to the average root growth on agar medium without NaCl. Boxplots show the interquartile range (IQR; box) ± 1.5xIQR (whiskers), including median (horizontal line) and replication units (dots). (A) Unaltered tolerance of F1 plants to 50 and 100 mM NaCl. Data represent growth reduction percentages of single plants within F1 populations from similarly treated parents (n = 60). ns, no statistically significant differences (ANOVA; α = 0.05). Root growth data for individual F1 populations are shown in Supplementary Figure 4A; root tolerance data for individual F1 populations are shown in Supplementary Figure 4C. (B) Unaltered tolerance of F2 plants to 50 and 100 mM NaCl after one stress-free F1 generation. Data represent growth reduction percentages of single plants within F2 populations that share a common parental ancestor (n = 18–20). ns, no statistically significant differences (ANOVA; α = 0.05). Root growth data for individual F2 populations are shown in Supplementary Figure 4B; root tolerance data for individual F2 populations are shown in Supplementary Figure 4D.

