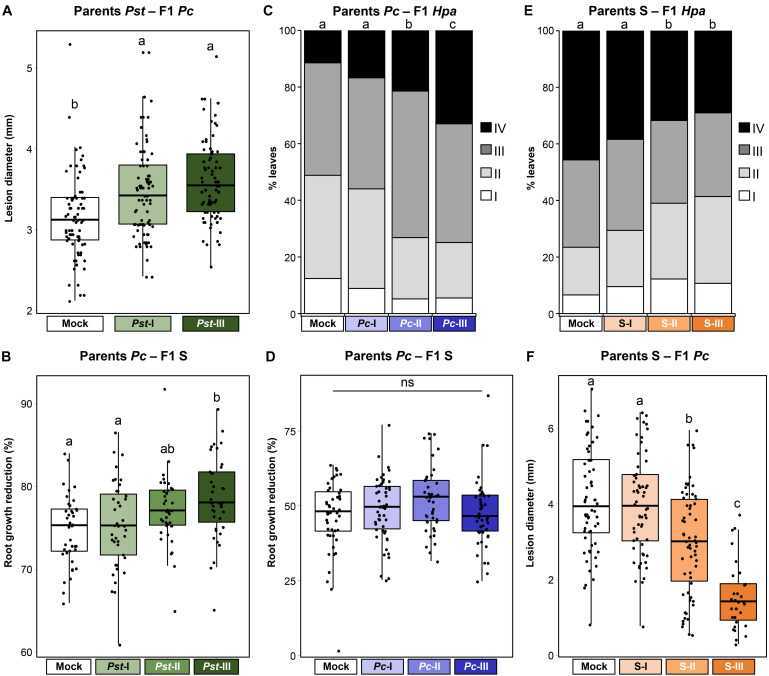
FIGURE 6.
Costs and benefits of t-IR in mismatched environments. Parental plants had been exposed to different stress severities by Pst (green), Pc (blue), or soil salinity (orange). F1 plants were tested for resistance against different stresses than the parental stress. (A) Increased Pc susceptibility in F1 progeny from Pst-exposed parents. Box plots show lesion diameters (mm) of plants within F1 populations from similarly treated parental plants (n = 76–80). See the legend of Figure 4 for details. Different letters indicate statistically significant differences between parental treatments (ANOVA + Tukey’s post hoc test; α = 0.05). Data for individual F1 populations are shown in Supplementary Figure 5A. (B) Reduced salt tolerance in F1 progeny from Pst-exposed parents. Box plots show root growth reduction percentages by 50 mM NaCl of plants within F1 populations from similarly treated parental plants (n = 40). See the legend of Figure 5 for details. Different letters indicate statistically significant differences (ANOVA + Tukey’s post hoc test; α = 0.05). Root growth data for individual F1 populations at 0, 50, and 100 mM NaCl are shown in Supplementary Figure 5B; tolerance data for individual F1 populations to 50 and 100 mM NaCl are shown in Supplementary Figure 5C. (C) Increased Hpa susceptibility in F1 progeny from Pc-exposed parents. Stacked bars show leaf frequency distributions across Hpa resistance classes within F1 populations from similarly treated parents (n = 400–500). See the legend of Figure 3B for details. Different letters indicate statistically significant differences (pairwise Fisher’s exact tests + Bonferroni FDR, α = 0.05). Data for individual F1 populations are shown in Supplementary Figure 6A. (D) Unaltered salt tolerance in F1 progeny from Pc-exposed parents. Box plots show root growth reduction percentages by 50 mM NaCl of plants within F1 populations from similarly treated parental plants (n = 47). See the legend of Figure 5 for details. ns, no statistically significant differences (ANOVA; α = 0.05). Root growth data for individual F1 populations at 0, 50, and 100 mM NaCl are shown in Supplementary Figure 6B; tolerance data for individual F1 populations to 50 and 100 mM NaCl are shown in Supplementary Figure 6C. (E) Non-specific t-IR against Hpa in F1 progeny from NaCl-exposed parents. Stacked bars show leaf frequency distributions across Hpa resistance classes within F1 populations from similarly treated parents (n = 350–800). See the legend of Figure 3B for details. Different letters indicate statistically significant differences (pairwise Fisher’s exact tests + Bonferroni FDR, α = 0.05). Data for individual F1 populations are shown in Supplementary Figure 7A. (F) Non-specific t-IR against Pc in F1 progeny from NaCl-treated parents. Box plots show lesion diameters (mm) of plants within F1 populations from similarly treated parental plants (n = 30–60). See the legend of Figure 4 for details. Different letters indicate statistically significant differences between parental treatments (ANOVA + Tukey’s post hoc test; α = 0.05). Data for individual F1 populations are shown in Supplementary Figure 7B.

