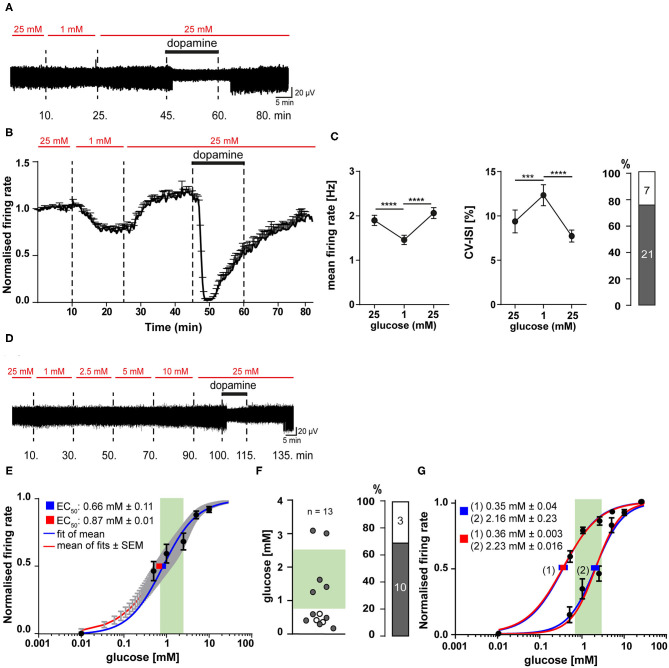
Figure 5.
SN DA neurons display fast and reversible glucose-sensitivity in the range of brain glucose levels. Experiments, MEA recordings, data analysis and presentation similar as in Figures 1, 3. (A) Exemplary traces, recorded from a mouse SN DA neuron, while glucose was transiently reduced from 25 to 1 mM, as indicated by red horizontal bars. Bath application of 100 μM dopamine indicated by black horizontal bars. (B) Normalized mean firing rates of all analyzed SN DA neurons are plotted over time (n = 28). (C) Left/middle panel: Mean non-normalized firing rates (left) and pacemaker precision (given as CV-ISI, middle) during the first 10 min of the recording in 25 mM glucose, in 1 mM (last 10 min), and back in 25 mM glucose (last 10 min). Right panel: Number/percentage of SN DA neurons from (B,C) with desensitized D2-AR responses (grey). (D) Exemplary trace, recorded from a mouse SN DA neuron, while glucose concentrations were altered as indicated (0.5–25 mM). Bath application of different glucose concentrations (red) and of 100 μM dopamine (black) indicated by horizontal bars. (E–G) Dose-response curves and derived EC50 values for all analyzed SN DA neurons (n = 13). EC50 values were calculated according to the Hill-equation. Values are given as mean ± SE. The range of physiological brain glucose levels is indicated in green, [0.7–2.5 mM], according to Routh et al. (2014). (E) EC50 values were derived from fitting the mean relative firing rates of all cells at each concentration (blue), and by the mean fit of the fits for each individual neuron (red). Values are given as mean ± SE. (F) Left panel: Scatterplot of individual EC50 values, derived from individual fits for each cell (gray dots: cells with desensitized D2-AR responses; white dots: cells with sensitized responses). Right panel: Number/percentage of SN DA neurons from (E) with desensitized D2-AR responses (grey). (G) Separate dose-response curve fits; cells from (E,F) were subdivided into neurons with EC50 higher (n = 5) or lower (n = 8) than 1 mM glucose. Data are given as mean ± SEM. Significances/p-values according to paired Friedman test with Dunn's multiple comparison and Chi-square test. All data and statistics are detailed in Supplementary Figures 3, 4C,D, Supplementary Tables 7, 8.

