
FIGURE 2.
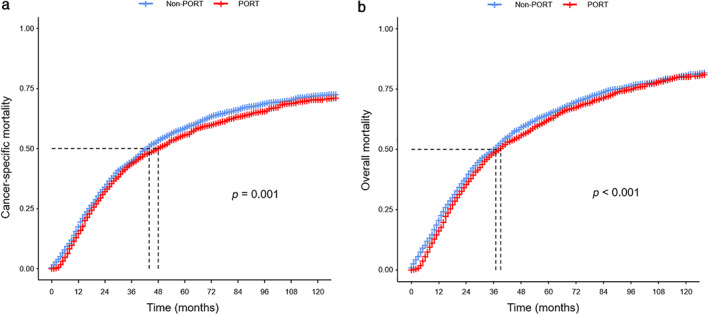
Comparison of (a) cancer‐specific mortality and (b) overall mortality weighted by propensity score in patients with resected IIIA/N2 NSCLC
Official websites use .gov
A
.gov website belongs to an official
government organization in the United States.
Secure .gov websites use HTTPS
A lock (
) or https:// means you've safely
connected to the .gov website. Share sensitive
information only on official, secure websites.
Comparison of (a) cancer‐specific mortality and (b) overall mortality weighted by propensity score in patients with resected IIIA/N2 NSCLC