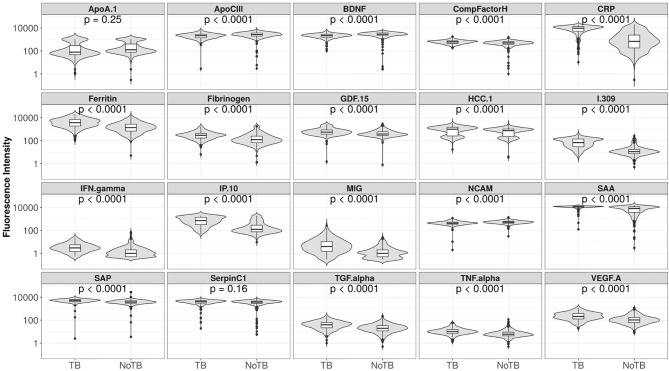
Figure 3.
Fluorescent intensities on a log scale of biomarkers detected in the serum samples of participants with tuberculosis (TB) and those with other respiratory disease (ORD), for all 20 markers analyzed. Unadjusted permutation test p-values for the difference between the means of the groups are given for each biomarker (105 permutations).

