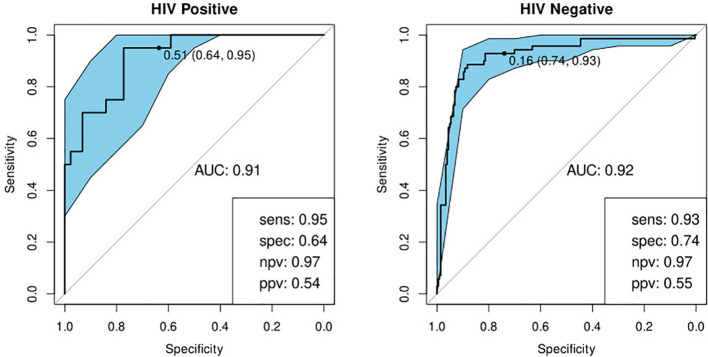
Figure 7.
Receiver-operator characteristic (ROC) curves of the performance of the optimal bio-signature (CRP and I-309) for HIV-positive (n=64) and HIV-negative (n=274) individuals with no previous history of TB. The optimal sensitivity and specificity are shown on the bottom right corner of each ROC curve together with the negative and positive predictive values.

