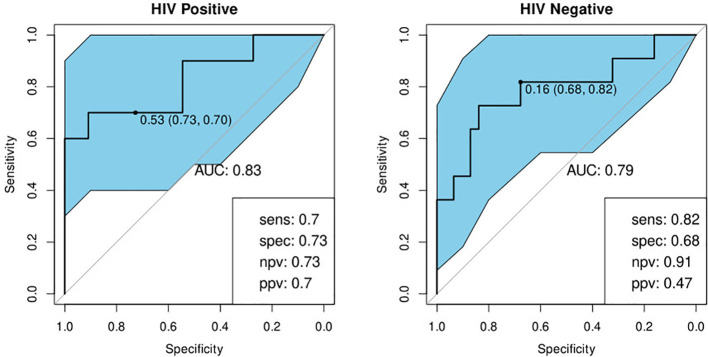
Figure 8.
Receiver-operator characteristic (ROC) curves of the performance of the optimal bio-signature (CRP and I-309) for HIV-positive (n=21) and HIV-negative (n=42) individuals with a history of previous TB. The optimal sensitivity and specificity are shown on the bottom right corner of each ROC curve together with the negative and positive predictive values.

