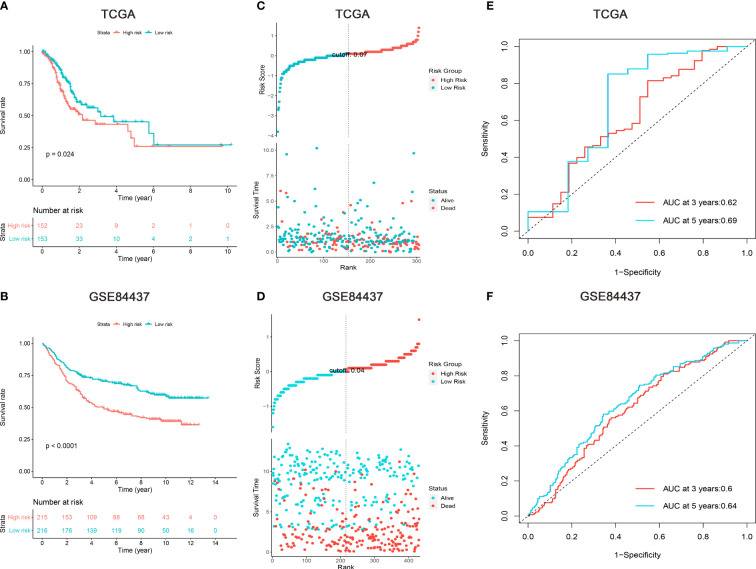
Figure 2.
Survival analysis of gastric cancer patients in the TCGA and GSE84437 cohorts. (A, B) Kaplan-Meier survival analysis, (C, D) risk score by the nine m6A “eraser” relater risk genes, patients’ survival status and time, (E, F) time-dependent ROC curves. The AUCs of 3 and 5 years were used to assess prognostic accuracy and log-rank test was used to calculated the p-value.

