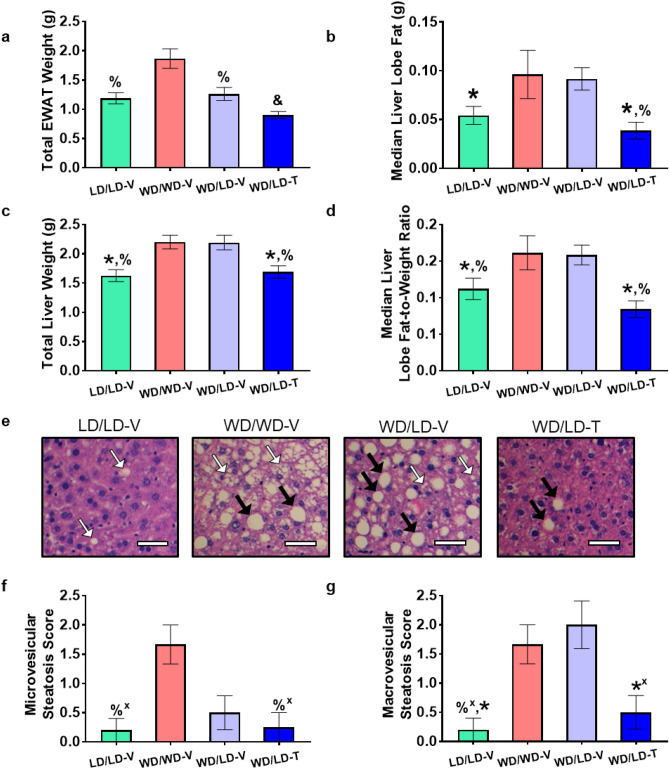
Figure 2.
NNMTi treatment combined with a lean diet (LD) switch returned liver adiposity, liver and EWAT weights, and microvesicular and macrovesicular steatosis from pathological values associated in an obese state to values observed in mice continually maintained on LD. Total EWAT weight (a), median liver lobe fat content (b), total liver weight (c), median liver lobe fat-to-weight ratio (d), representative histology showing microvesicular steatosis (white arrows) and macrovesicular steatosis (black arrows) (e, scale bar 25 µm), and microvesicular (f) and macrovesicular (g) steatosis scores. Data are represented as mean ± SEM; a-d n = 6–8/group and weights are in grams; f-g, n = 3–5/group. Significant main effects for treatment group were observed for total EWAT weight (p < 0.0001), median liver lobe fat (p = 0.0034), total liver weight (p = 0.0011), median liver lobe fat-to-weight ratio (p = 0.0045), microvesicular (p = 0.0425) and macrovesicular (p = 0.0039) steatosis scores. One-way ANOVA on log transformed data (a,b) ; one-way ANOVA (c,d); Kruskal–Wallis test (f,g). For a full list of statistical results, see Supplementary Table S2. LD lean diet, -T NNMTi-treated, -V vehicle-treated, WD Western diet, &, vs. all other groups displayed; *, vs. WD/LD-V; %, vs. WD/WD-V. Labeled pairwise comparisons are significant (< 0.05) corrected (q) and uncorrected (p) for multiple comparisons; ‘ + ’, significant result with FDR correction only.

