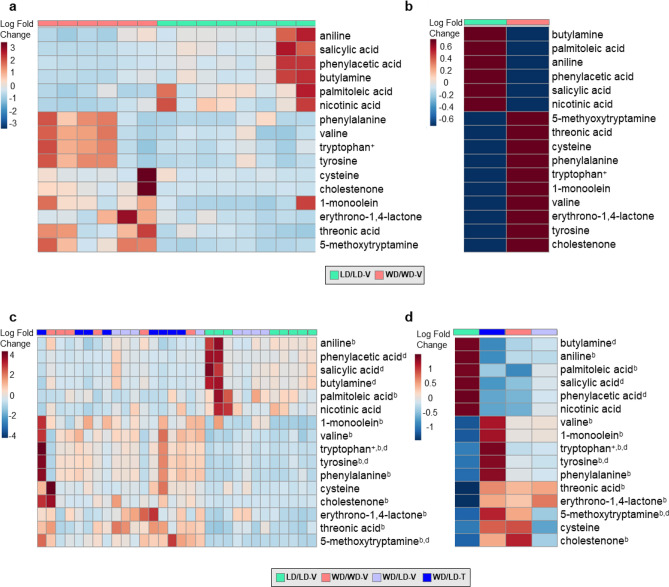
Figure 3.
LD Diet switch alone and NNMTi treatment combined with LD switch influence the obesogenic diet-induced EWAT metabolic signature. Heat maps of the sixteen metabolites that demonstrated a significant pairwise comparison between control mice maintained on WD vs. LD; individual mouse results (a) and group averages (b) are displayed for these in the top panels, and the bottom panels include the addition of the individual mouse results (c) and group averages (d) for the WD/LD-V and WD/LD-T groups (n = 6–8/group for all panels). Metabolites were analyzed raw or log transformed, and using a one-way ANOVA, Welch’s ANOVA, or Kruskal–Wallis test. For a full list of statistical results, see Supplementary Table S5. LD lean diet, -T NNMTi-treated, -V vehicle-treated, WD Western diet, b both WD/LD groups vs. LD/LD-V, d WD/LD-T vs. WD/LD-V. Labeled pairwise comparisons are significant (< 0.05) corrected (q) and uncorrected (p) for multiple comparisons; +significant result with FDR correction only.

