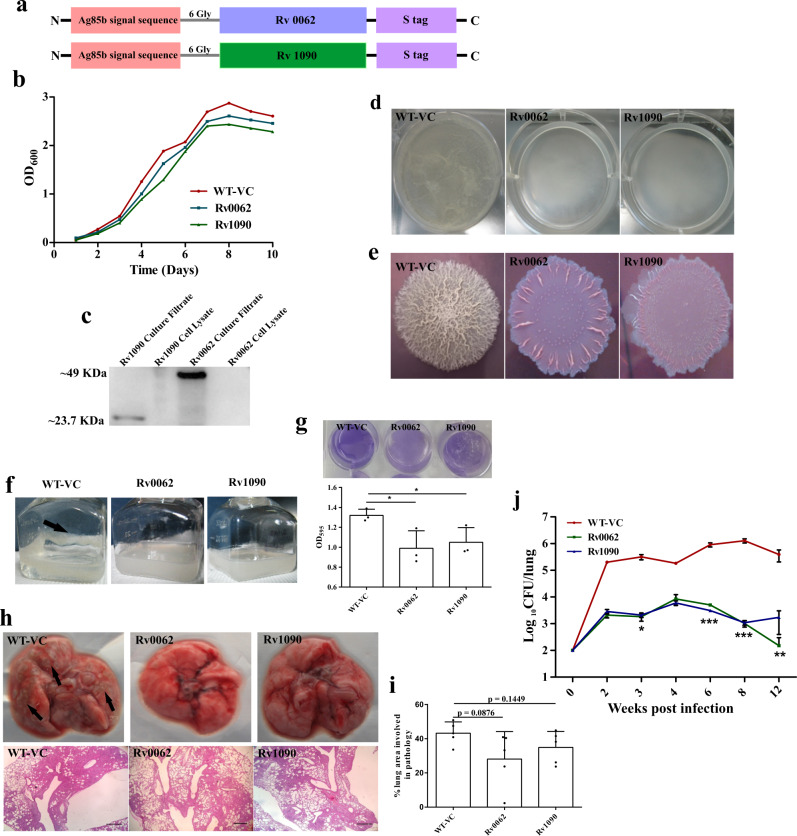
Fig. 8. Mtb biofilms protect the bacilli from the host immune system.
a Construct design for engineering Mtb strains overexpressing endogenous Mtb cellulases (Rv0062 and Rv1090). b Growth profile of planktonic cultures of Mtb strain with vector control or those overexpressing Rv0062 and Rv1090. c The culture supernatant of the above-described cultures was used in Western blot analysis. Antibodies specific to S-tag were utilized to detect the secretion of cellulases outside Mtb cells. Uncropped image of the blot is provided in Source Data. d Pellicle biofilm profile of WT-VC, Rv0062, and Rv1090, suggesting that cellulase overexpressing strains were severely defective in pellicle formation. e Macrocolonies of WT-VC, Rv0062, and Rv1090 on 7H11 agar supplemented with Congo red and Coomassie Brilliant Blue G250 dye. f, g Biofilms of WT-VC, Rv0062, and Rv1090 induced by thiol reductive stress using DTT shows defect in the engineered strains, as indicated by CV assay quantitation. The biofilm formed by WT-VC (f) has been shown by black arrow. h C57BL/6 J mice were independently infected with vector control (WT-VC) or strains overexpressing cellulases Rv0062 and Rv1090 using a low dose of aerosols. Gross lung pathology (upper panel) and histopathology (lower panel) of mice lungs infected with WT-VC, Rv0062, and Rv1090. i Lung pathology post-infection with Mtb strains, as mentioned in h, was quantitated using ImageJ software. j Survival inside mice lungs (n = 5) was estimated using CFU analysis. The data presented in figures g, i and j have been plotted in GraphPad Prism 6 and represented as mean (±s.e.m). Statistical significance of j was determined using two way ANOVA. *P < 0.05, **P < 0.01, ***P < 0.001. And the statistical significance of g and i was determined using Student’s t-test (two tailed). For g *P = 0.0375 (column A vs column B) and *P = 0.0431 (column A and column C). All data are representative of three independent biological experiments performed in triplicates unless otherwise mentioned. Scale bars correspond to 200 μm. All source data are provided as a Source Data file.

