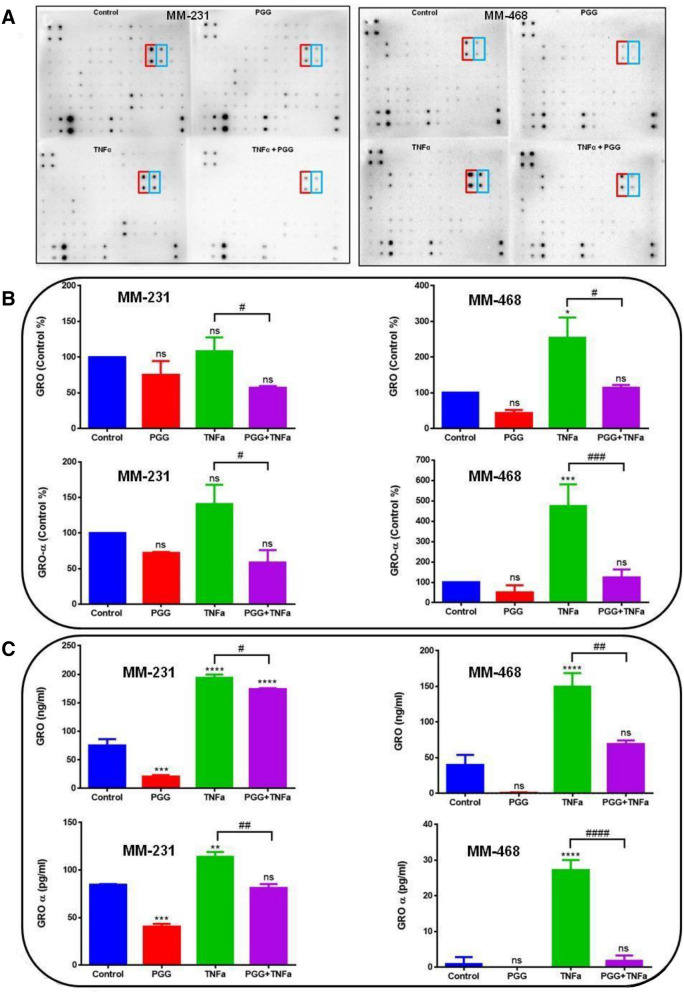
Figure 2.
PGG inhibitory effect on the expression of TNF-α-stimulated GRO and GRO-α/CXCL1 in MM-231 and MM-468 TNBC cells using cytokine arrays and ELISA assay. (A) Arrays are showing chemiluminescent spot intensity obtained from MM-231 and MM-468 cells supernatants after treatments, presenting the change in protein expression. The red box corresponds to GRO and blue box to GRO-α expression. (B) PGG effect on GRO and GRO-α normalized protein expression. Normalized intensities are expressed as control arrays percentages. (C) PGG effect on GRO and GRO-α cytokine expression using ELISA quantitative assays. Treatments correspond to control (cells + DMSO), PGG (6.25 and 25 µM for MM-231 and MM-468 cells, respectively), TNF-α (50 ng/ml), and PGG + TNF-α. Mean ± SEM n = 3. Differences between control vs. treatments (*) and TNF-α vs. PGG + TNF-α (#) were evaluated for statistical significance by using a one-way ANOVA and Dunnett's multiple comparison tests. *p < 0.05, **p < 0.01, ***p < 0.001, ****p < 0.0001, #p < 0.05, ##p < 0.01, ###p < 0.001, ####p < 0.0001, ns = p > 0.05.

