Figure 3.
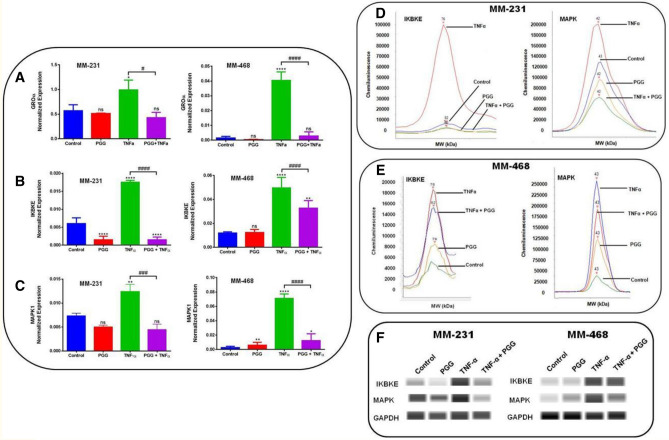
PGG modulatory effect on GRO-α, IқBKE, and MAPK1 mRNA expression and IқBKE and MAPK protein expression in MM-231 and MM-468 TNBC cells after 24-h treatment. The effect of PGG on GRO-α. (A), IқBKE (B), and MAPK1 (C) mRNA expression was investigated in MM-231 and MM-468 TNBC cell lines using RT-PCR. Data refers to the mean ± SEM of three biological experiments (n = 3), corresponding to 4 treatments: control (cells + DMSO), PGG (6.25 and 25 µM for MM-231 and MM-468 TNBC cells, respectively), TNF-α (50 ng/ml), and PGG + TNF-α. Differences between control vs. PGG and TNF-α (*) and TNF-α vs. PGG + TNF-α (#) were evaluated for statistical significance by using a one-way ANOVA and Dunnett's multiple comparison tests. *p < 0.05, **p < 0.01, ****p < 0.0001, #p < 0.05, ###p < 0.001, ####p < 0.001, ns = p > 0.05. PGG inhibition of IқBKE and MAPK protein expression was determined through Western analysis. (D) and (E) show electropherogram representing total IқBKE and MAPK expression after MM-231 and MM-468 cells were exposed to the treatments. (F) shows blot view cropped from Compass software corresponding to the protein expression after treatments: Control, PGG, TNF-α, and PGG + TNF-α, respectively. The full-length blots are presented in Supplementary Fig. 1.

