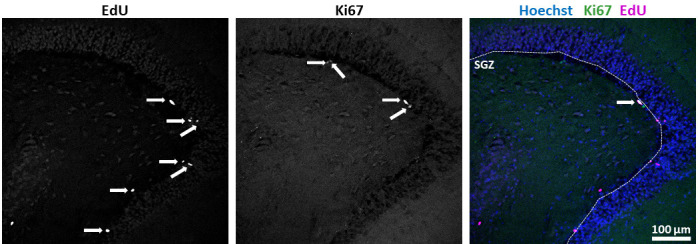
Figure 2. Quantification of results.

Marker single or double positive cells along the SGZ were enumerated (arrows). Length of the SGZ was measured using ImageJ’s segmented line tool (dotted line). Quotients of positive cell numbers over length were calculated. (scale bar = 100 µm)
