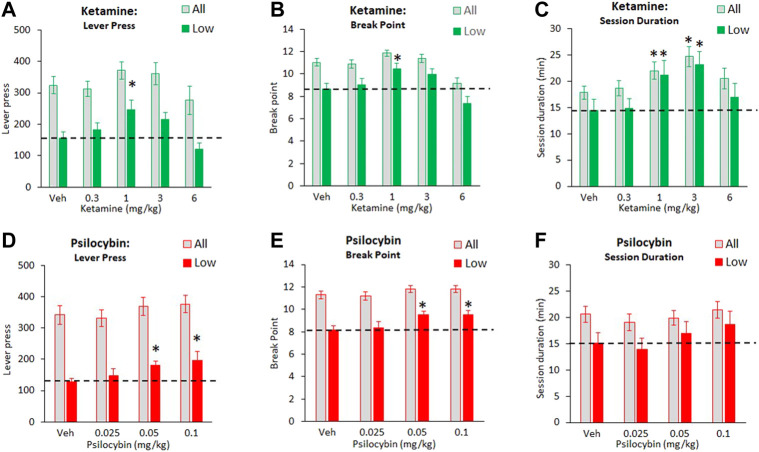
FIGURE 2.
Characterisation of ketamine (0.3–6 mg/kg IP) and psilocybin (0.025–0.1 mg/kg SC) on food responding made available under a progressive schedule of reinforcement. Data is presented for both drugs as total number of lever presses recorded during the test session (A and D), final break point (B and E), and total session duration (C and F). Data for each drug is presented both as all test subjects (ketamine: N = 68; psilocybin: N = 72), and subjects characterized as “low performers” based on having the lowest tertile on lever presses/break point based on performance measured over 7 days prior to onset of drug testing (ketamine: N = 23; psilocybin: N = 24). The hashed line is to highlight the level of the “low performer” subgroup following vehicle pretreatment. *p < 0.05 vs. vehicle control (Dunnetts test following significant ANOVA).

