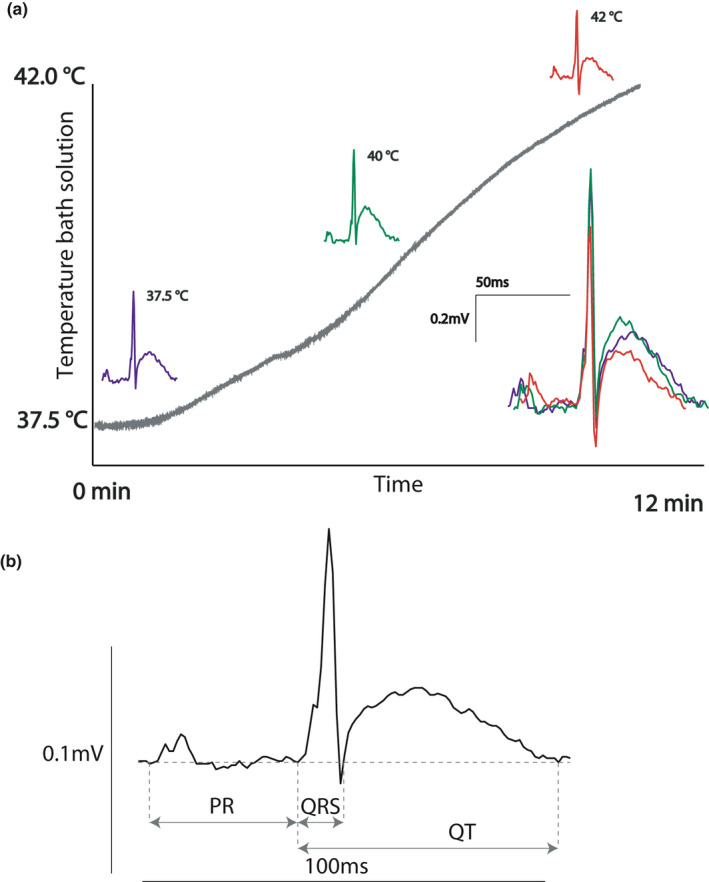
FIGURE 1.

The zebra finch ECG. (a) The zebra finch pseudo‐ECG (pECG) measured at different temperatures had highly similar morphology, apart from shorted durations at higher temperatures. (b) Lead I of the zebra finch showing different pECG parameters
