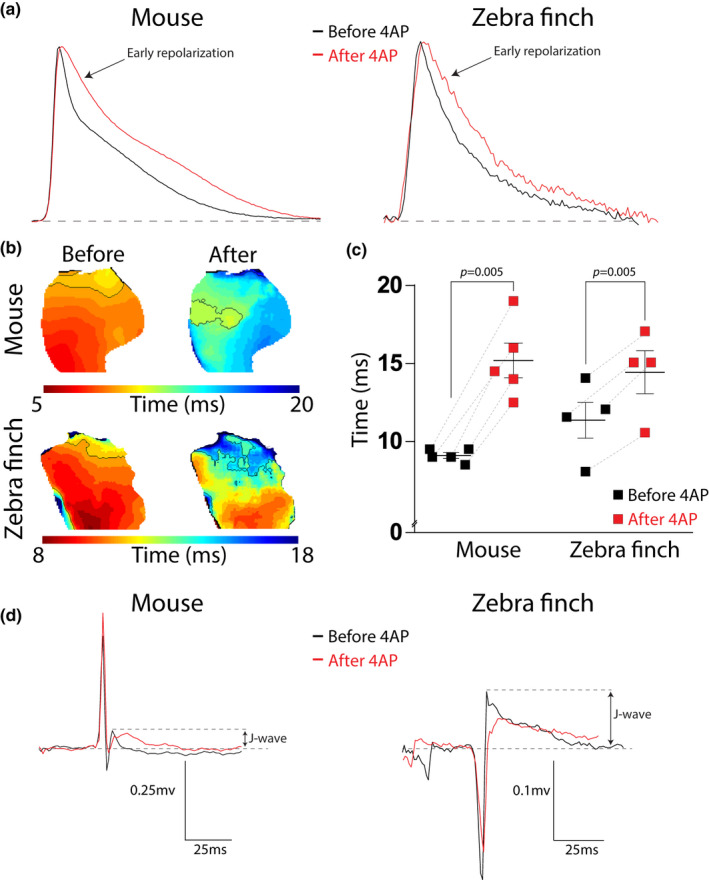
FIGURE 6.

Blocking I TO and I Kur prolongs RT20 and attenuates the J‐wave in both mouse and zebra finch. (a–c) Typical examples of optical action potentials (a) and early repolarization patterns (b) of mouse (top) and zebra finch (bottom) exemplifying prolongation of RT20 (c) after administration of 4‐AP (in red). Thep =0.005 refers to the main effect of the treatment. (d) Typical examples of the pseudo‐ECG before (black) and after (red) 4‐AP administration for mouse (left) and zebra finch (right). The attenuation of the J‐wave is measured as the percentage decrease in amplitude
