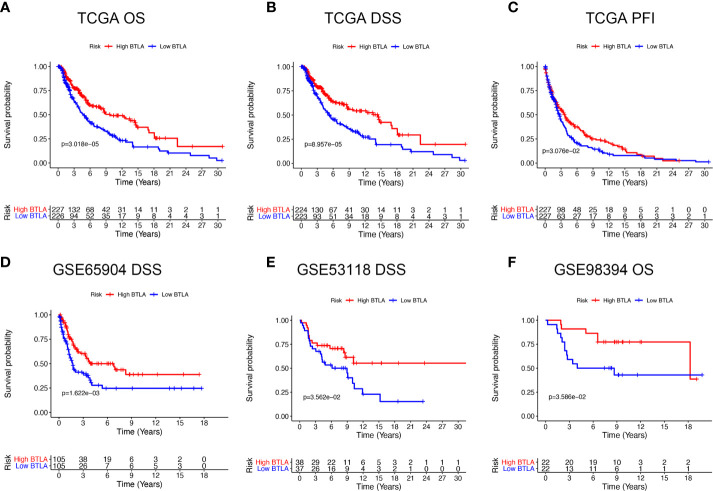
Figure 2.
Kaplan-Meier survival curves comparing the BTLAhigh and BTLAlow groups in SKCM in TCGA cohorts and GEO cohorts. (A–C) Survival curves of OS, DSS, DFI in TCGA SKCM cohorts. (D, E) Low BTLA expression was correlated with poor DSS in the GSE65904 and GSE53118 cohorts. (F) Low BTLA expression was correlated with poor DFI in the GSE98394 cohort. OS, overall survival; DSS, disease-specific survival; DFI, disease-free interval.

