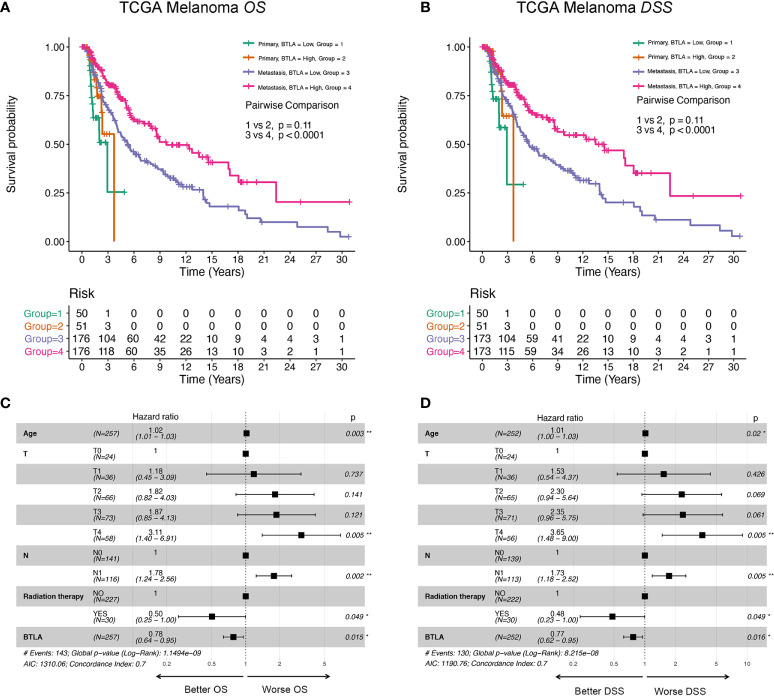
Figure 3.
The survival curves and multivariate Cox analysis model of BTLA. (A, B) The OS and DSS curves using combinations of BTLA expression level and tumor subtypes. (C, D) The age, T, N, radiation therapy, and BTLA expression showed significance in multivariate Cox analysis forest graph of OS and DSS prognosis. OS, overall survival; DSS, disease-specific survival; T, tumor stage; N, regional lymph nodes metastasis stage.

