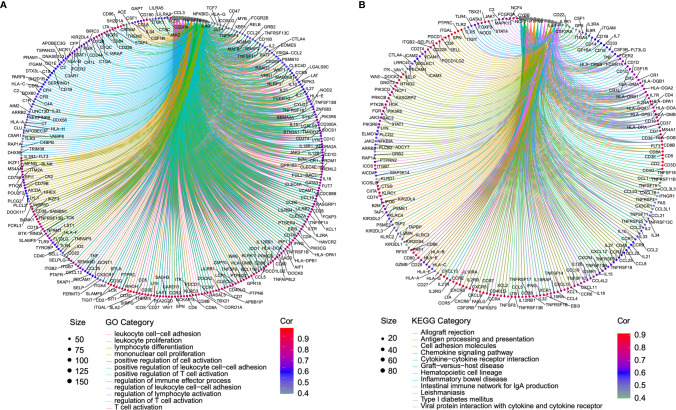
Figure 4.
Function enrichment analysis of the co-expressed genes of BTLA. (A) The enrichment results of the GO. (B) The enrichment results of the KEGG signal pathway. Clusters are based on the gene count to measure the similarity between terms. The size of the gray circle represents the number of gene counts. Different color circles represent the correlation with BTLA. GO, the gene ontology; KEGG, Kyoto Encyclopedia of Genes and Genomes.

