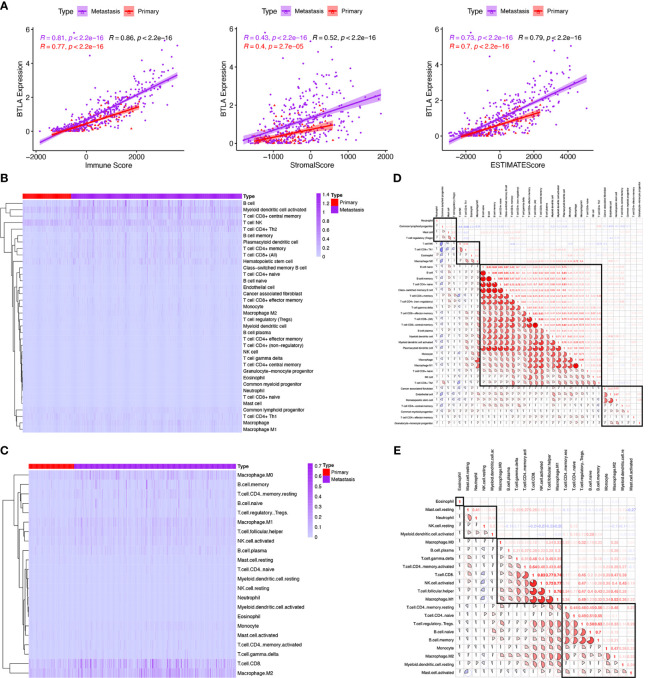
Figure 5.
Comparison of tumor microenvironment scores with BTLA expression profiles and the relative proportion and correlation of tumor-infiltrating immune cells in SKCM. (A) Spearman correlations between BTLA and microenvironment scores calculated based on the ESTIMATE algorithm in primary and metastatic SKCM. (B, C) Heatmap illustrating the proportion of the immune cells in primary and metastatic SKCM microenvironment using xCell and CIBERSORT. (D, E) Correlation clustering of immune cells based on expression data to classify them into four groups by xCell and CIBERSORT.

