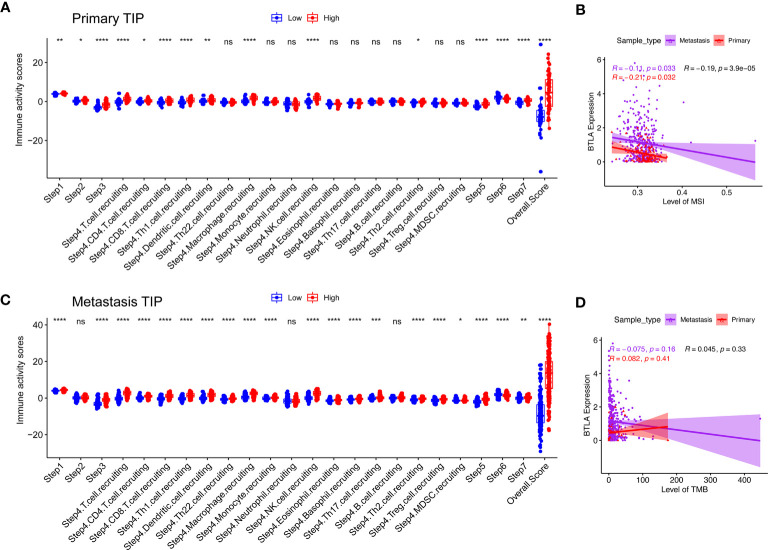
Figure 7.
Compare the levels of cancer-immunity cycle, MSI and TMB between the different BTLA expressional groups. (A, B) Compare the levels of cancer-immunity cycle in primary and metastatic SKCM. (C, D) Compare the levels of MSI and TMB in primary and metastatic SKCM. TMB, tumor mutational burden; MSI, microsatellite instability. ns: not significant, *p < 0.05, **p < 0.01, ***p < 0.001, ****p < 0.0001.

