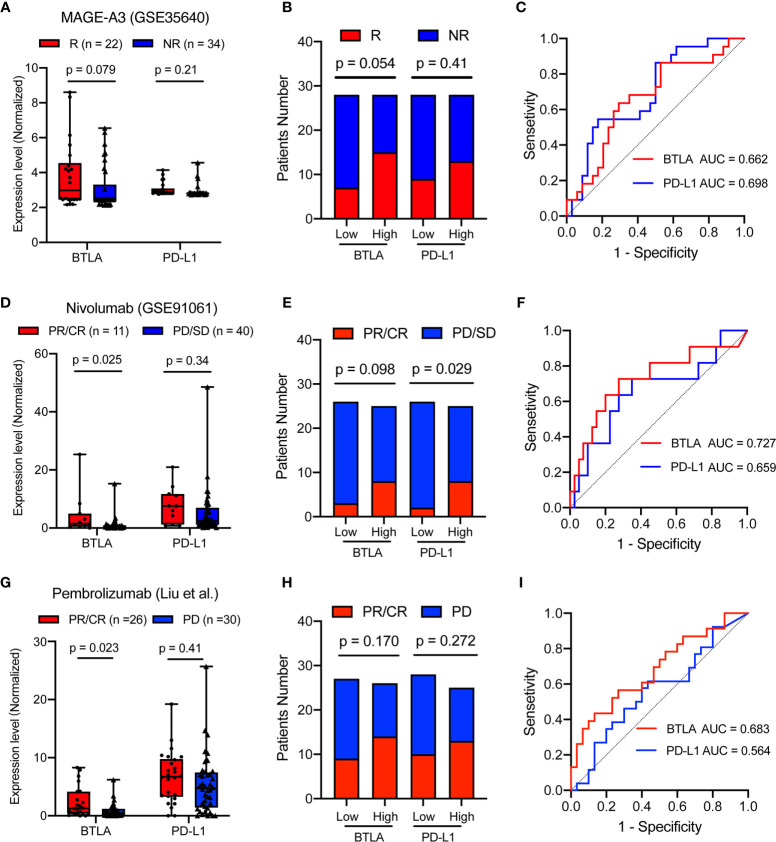
Figure 8.
BTLA is predictive in immunotherapy response in advanced melanoma. (A) The comparison of the BTLA and PD-L1 expression between MAGE-A3 antigen vaccine therapy response groups. (B) The MAGE-A3 antigen vaccine therapy response in the different BTLA and PD-L1 expressional groups. (C) The predictive value of the BTLA and PD-L1 was measured by ROC curves in GSE35640 cohort. (D) The comparison of the BTLA and PD-L1 expression between anti-PD-1 immunotherapy response (Nivolumab) groups. (E) The Nivolumab immunotherapy response in the different BTLA and PD-L1 expressional groups. (F) The predictive value of the BTLA and PD-L1 was measured by ROC curves in GSE91061 cohort. (G) The comparison of the BTLA and PD-L1 expression between anti-PD-1 immunotherapy response (Pembrolizumab) groups. (H) The Pembrolizumab immunotherapy response in the different BTLA and PD-L1 expressional groups. (I) The predictive value of the BTLA and PD-L1 was measured by ROC curves in Liu et al. cohort. NR/R, non-response or response; PR/CR, partial or complete response; PD/SD, progressive or stable disease. ROC, receiver operating characteristic. Statistical methods were as follows: (A, D, G) Wilcoxon rank-sum test; (B, E, H) Two-sided Fisher exact test.

