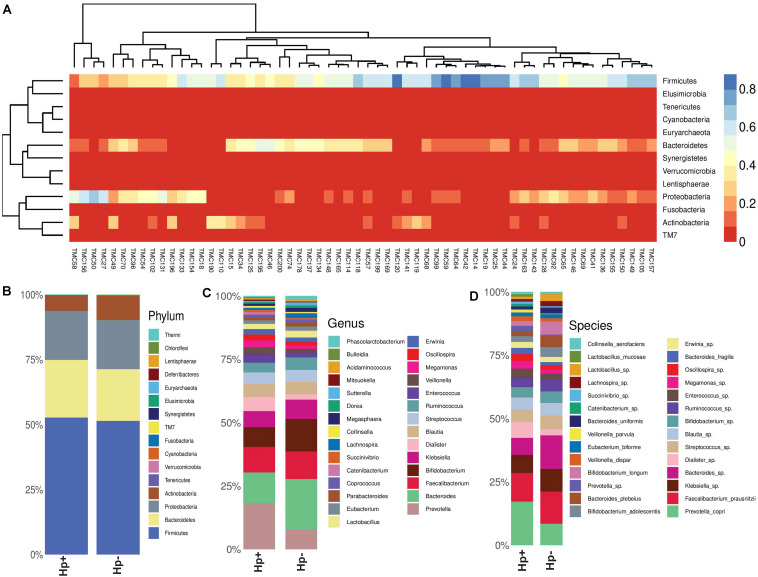
FIGURE 5.
(A) Heat map showing the relative abundances of different phyla for each sample (N = 60). (B) Relative abundances of different phyla in gut shown in stacked column for the H. pylori+ (Hp+) and the H. pylori− (Hp−) groups. The Hp+ group has less relative abundance of the Phylum Actinobacteria. (C) Relative abundances of different genera in gut shown in stacked column for the H. pylori+ (Hp+; N = 30) and the H. pylori− (Hp−; N = 30) groups. The Hp+ group has less relative abundance of the genus Bifidobacterium. (D) Relative abundances of different bacterial species in gut shown in stacked column for the H. pylori+ (Hp+; N = 30) and the H. pylori− (Hp−; N = 30) groups. The Hp+ group has less relative abundance of the Bifidobacterium longum and B. adolescentis. The bacterial species that vary between the H. pylori+ and the H. pylori− groups are B. longum (Kruskal-Wallis, p = 0.009), B. adolescentis (p = 0.03), B. bividum (p = 0.004), B. plebeius (p = 0.05), B. uniformis (p = 0.04), and P. copri (p = 0.003).

