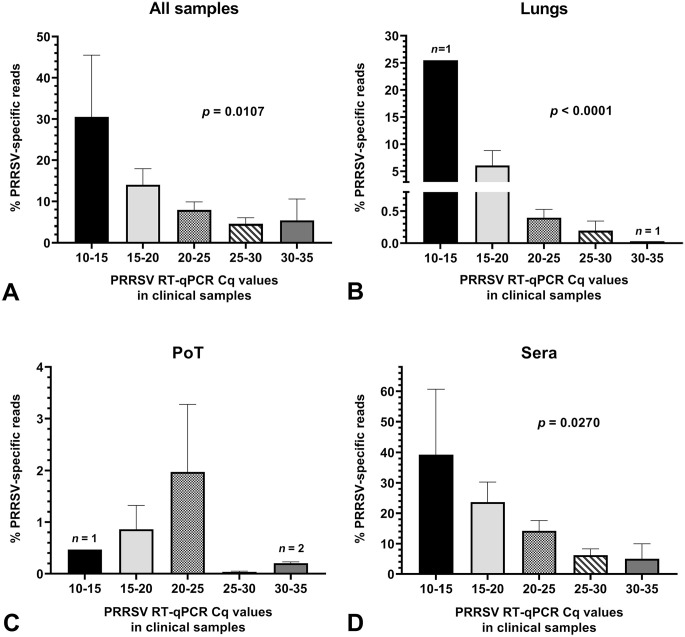
Figure 4.
Amount of PRRSV high-throughput sequencing–specific reads in clinical samples. Graphs were built with all clinical samples (i.e. from both WGS successful and unsuccessful samples). The bars and whiskers represent the % of PRRSV-specific reads mean ± standard error of the mean. Parametric ordinary 1-way ANOVA tests were done to compare the % of PRRSV-specific reads to the clinical sample viral load. A. all samples (including PF and OF); B. lung samples; C. PoT samples; and D. sera. The significant p values in graphs indicate that the % of PRRSV-specific reads result is dependent on the viral load (i.e., PRRSV RT-qPCR Cq value). See Figure 1 legend for abbreviations.

