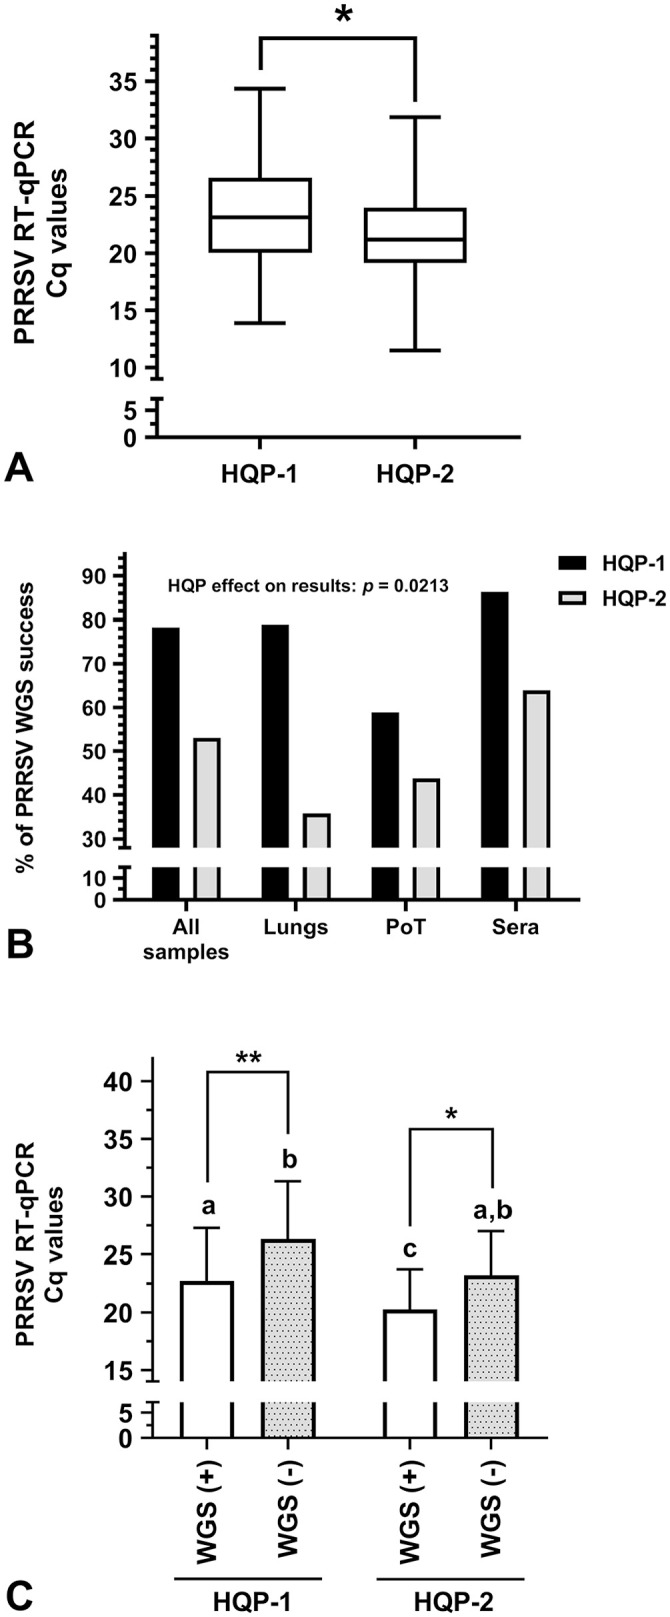
Figure 5.

Highly qualified personnel (HQP) WGS efficiency. A. Viral load of PRRSV-positive samples processed by both HQP. The whiskers go down to the smallest PRRSV RT-qPCR Cq values and up to the highest Cq values; the box extends from the 25th to 75th percentiles. The bar within the box represents the median Cq values. Parametric 2-tailed unpaired t test was done to compare HQP-1 and HQP-2. * = p ≤ 0.05. B. Percentage of PRRSV WGS success for different types of samples for each HQP. The HQP effect on the results was determined using an ordinary 2-way ANOVA. C. The viral load (Cq values) of PRRSV WGS successful [WGS (+)] and unsuccessful [WGS (−)] samples per HQP was determined. The bars represent the Cq mean ± standard deviation. Parametric ordinary 1-way ANOVA with Tukey post-tests were done to compare each group. When 2 sets of data are labeled with superscripts of different letters or when only one set is labeled with a superscript letter, it indicates that these 2 sets of data are statistically different (p ≤ 0.05). The Cq values of PRRSV WGS (+) samples were significantly different from WGS (−) samples for both HQP (* = p ≤ 0.05; ** = p ≤ 0.01). See Figure 1 legend for other abbreviations.
