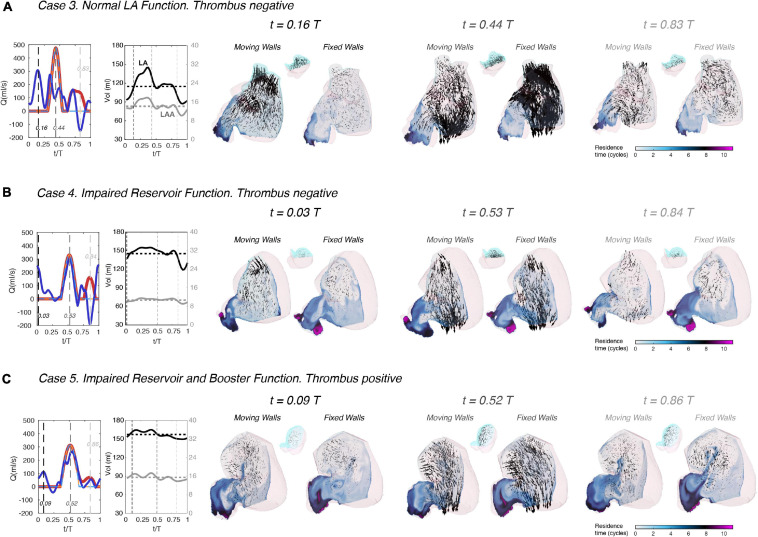
FIGURE 5.
Left atrial blood residence time in subjects with normal and impaired atrial function. Three subjects are shown, one with normal atrial function (panel A), one with impaired reservoir function (panel B), and one with both impaired reservoir and booster functions (panel C). Each subject includes data from both moving-walls simulations and fixed-walls simulations. For each subject, instantaneous 2D fields of the absolute value of the residence time TR (see main text for definition) are plotted in two oblique plane sections of the LAA and the LA body that separate the cyan and pink parts of the sagittal view insets. Additionally, 3D blood velocity vectors are rendered behind the sectioning planes (i.e., inside the cyan part of the LAA and the LA body). Similar to Figure 4, each panel includes plots of the time histories of flow rate through the mitral valve (red) and the cumulative flow rate through the pulmonary veins (blue), both for the moving-walls (dark color, thick continuous lines) and fixed-walls (light color, thin dashed lines) simulations. The panels also include each patient’s LA volume (black) and LAA volume (gray) vs. time. The data are represented at three instants of time. The first one corresponds to atrial diastole [i.e., peak flow rate through the pulmonary veins in the moving wall simulations, t/T = 0.16, 0.03, and 0.09 in panels (A–C)]. The second instant of time corresponds to left ventricular rapid filling [i.e., the E-wave, peak flow rate through the mitral valve, t/T = 0.44, 0.53, and 0.52 in panels (A–C)]. The third instant of time corresponds to atrial systole [i.e., the A-wave of left ventricular filling and peak backflow rate through the pulmonary veins, t/T = 0.83, 0.84, and 0.86 in panels (A–C)]. These three instants of time are indicated with black, dark gray and light gray dashed vertical lines in the flow-rate plots at the left-hand-side of each panel.

