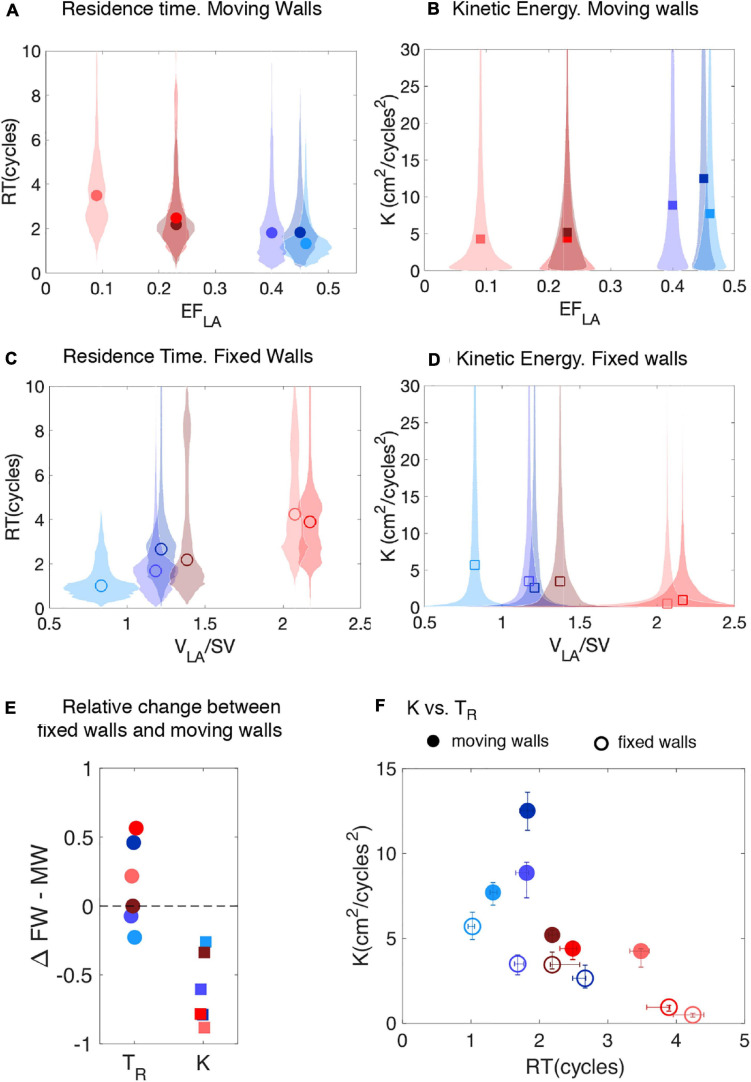
FIGURE 6.
Probability distributions of residence time and instantaneous kinetic energy inside the left atrial appendage of subjects with normal and impaired atrial function. (A,B) Violin plots of the probability density function (shaded patches) of TR, and K inside the LAA of the N = 6 subjects studied, together with their median (symbols). The data come from the moving-wall simulations and are plotted vs. the LA ejection fraction of each subject. (C,D) Violin plots of the probability density function of the same variables as obtained from fixed-wall simulations. The data are plotted vs. the volume of the LA normalized by stroke volume. (E) Relative change in mean values of TR, and K between the fixed-wall (FW) and the moving-wall (MW) simulations, defined as , etc. (F) Scatter plot of K vs TR for moving-wall (solid symbols) and fixed-wall (open symbols) simulations. The error bars in each panel span the 95% confidence intervals of the mean. Solid and hollow symbols come, respectively, from moving-wall and fixed-wall. In all the panels, each subject’s data is colored using the same scheme used in Figure 1 (blue shades indicate LAAT/TIA-neg patients and red shades indicate LAAT/TIA-pos patients).

