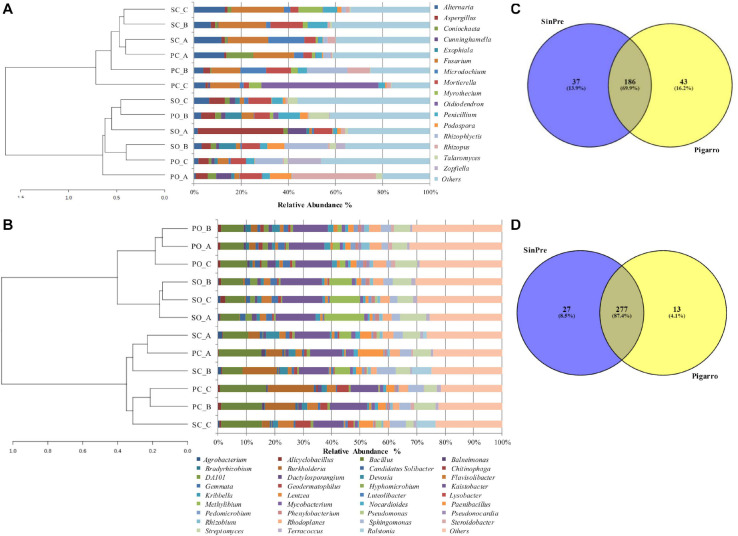
FIGURE 2.
Relative abundance of different fungal (A) and bacterial (B) genera in the soil rhizosphere in both populations representing the genera showing more than 1% relative abundance of all reads. The genera representing less than 1% of the total reads are grouped into “Others.” Venn diagrams showing the common and exclusive fungal (C) and bacterial (D) genera of the rhizosphere of the maize populations “SinPre” and “Pigarro.” PC_A, “Pigarro” conventional plant A; PC_B, “Pigarro” conventional plant B; PC_C, “Pigarro” conventional plant C; PO_A, “Pigarro” organic plant A; PO_B, “Pigarro” organic plant B; PO_C, “Pigarro” organic plant C; SC_A, “SinPre” conventional plant A; SC_B, “SinPre” conventional plant B; SC_C, “SinPre” conventional plant C; SO_A, “SinPre” organic plant A; SO_B, “SinPre” organic plant B; SO_C, “SinPre” organic plant C.

