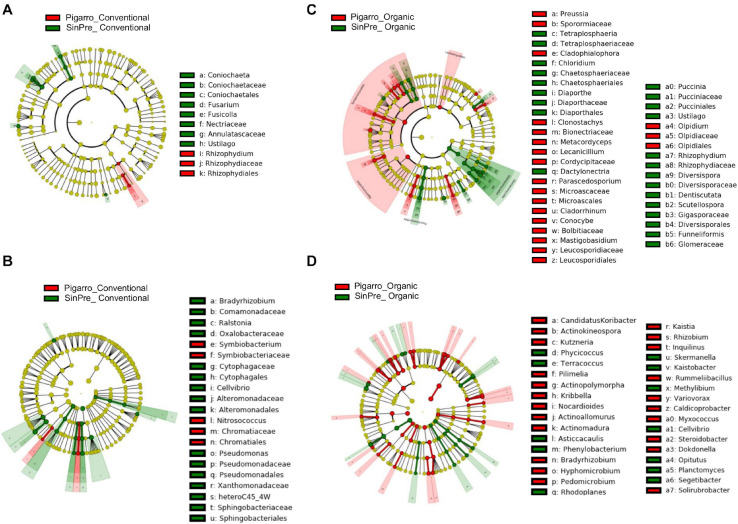
FIGURE 4.
Linear discriminant analysis (LDA) combined with effect size (LEfSe) was used to identify the most differentially abundant taxa among the population genotypes in the rhizosphere of maize. Cladogram generated by LEfSe indicating differences of fungi (A,B) and bacteria (C,D) at the phylum, class, family, and genus levels (relative abundance, ≤0.5%). Each successive circle represents a phylogenetic level. The red and green circles mean that “Pigarro” conventional and organic (red) and “SinPre” conventional and organic (green) showed differences in relative abundance; yellow circles mean non-significant differences. Differing taxa are listed on the right side of the cladogram. Bar graph showing the LDA scores for bacteria is represented in Supplementary Figure 1. Only taxa meeting an LDA significant threshold >2 are shown.

