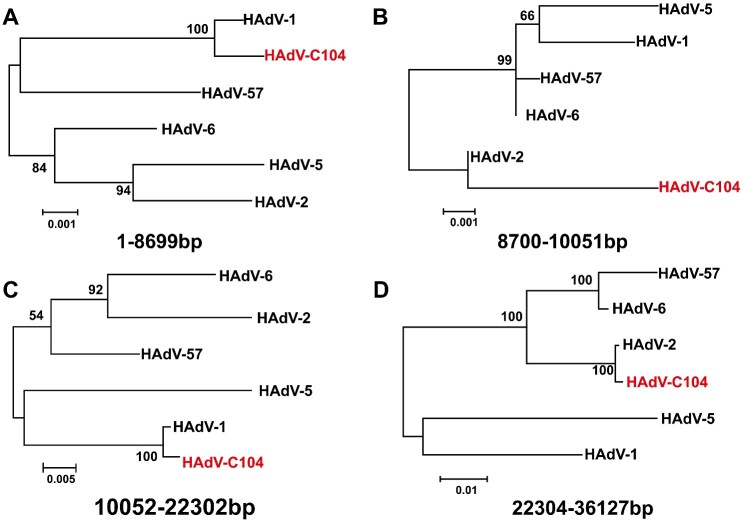
Figure 6.
Phylogenies of the recombination regions including 1 − 86,99, 8,700 − 10,051, 10,052 − 22,302, 22,304 − 36,127 bp. Maximum likelihood trees were constructed using the best fit nucleotide substitution model HKY + G + I (1 − 8,699 bp), T92 (8,700 − 10,051 bp), GTR + G + I (10,052 − 22,302 bp), GTR + G (22,304 − 36,127 bp) in MEGA7.0.

