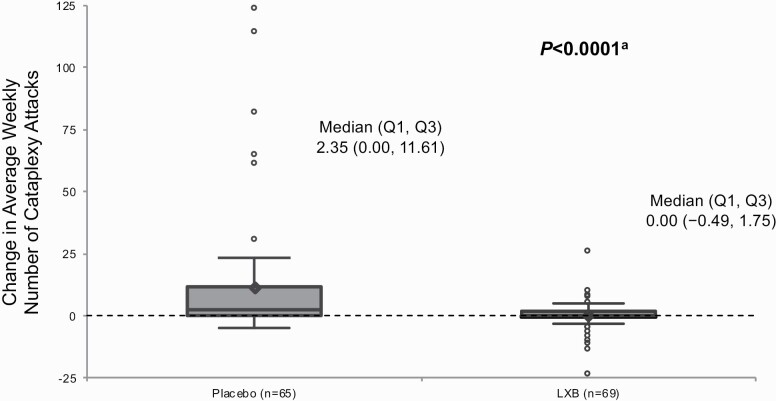
Figure 3.
Change in weekly number of cataplexy attacks from the stable-dose period to the double-blind randomized withdrawal period (efficacy population). The bottom and top edges of the box indicate the first and third quartiles, the line inside the box is the median, and the marker inside the box is the mean. Any points that are a distance of more than 1.5 times the interquartile range from the box are considered outliers and are represented by circles; the whiskers extending from the box indicate the minimum and maximum after removing those outliers. LXB, lower-sodium oxybate; Q1, first quartile; Q3, third quartile. aRank-based analysis of covariance.

