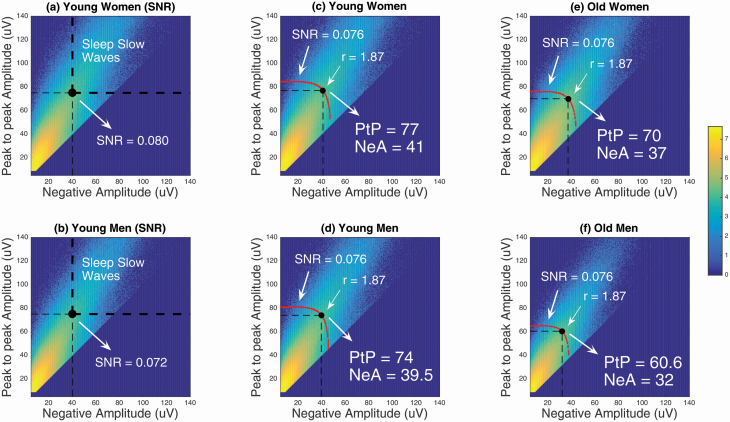
Figure 1.
Joint-probability densities of occurrence of SW for the learning cohort. PtP Amplitude, peak-to-peak amplitude; NegA, negative amplitude; SNR, signal-to-noise ratio. Each graph represents a heat map of the density of SW detected given the NegA (> 5 μV) and PtP amplitude (> 9 μV) on the x- and y-axis, respectively, over all-night NREM sleep (N2–N3 combined). The range displayed is in logarithmic scale (power of 10), from 0 to 107 SW/(μV)2. (A) Distribution of detected SW in younger women. (B) Distribution of detected SW in younger men. The upper right quadrant defined by the bold dashed lines in (a) and (b) represents the “signal” of conventional SW detections. From the distributions of the younger cohorts (A and B), the mean of the SNR obtained for the women (SNR = 0.08) and the men (SNR = 0.072) defines the general SNR = 0.076 of the detector. (C–F) The intersection between the SNR curve and the “ratio-r line” defines the adaptive SW amplitude detection criteria for the younger and older women and men, respectively.

