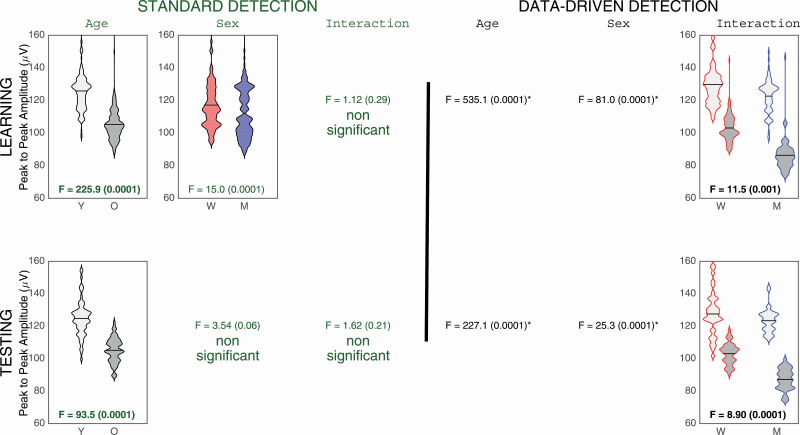
Figure 4.
SW characteristics for NREM sleep SW amplitude with standard (left side) and data-driven criteria (right side). Only the significant interactions or main effects interactions are presented. Younger subjects (Y) are represented in light grey and older participants (O) are represented in dark grey. Women (W) are in red and Men (M) are in blue. SW PtP amplitude (μV) is represented on the y-axis. When a similar effect is observed in both the learning (upper row) and testing cohort (lower row), the ANOVA results are shown in bold.

