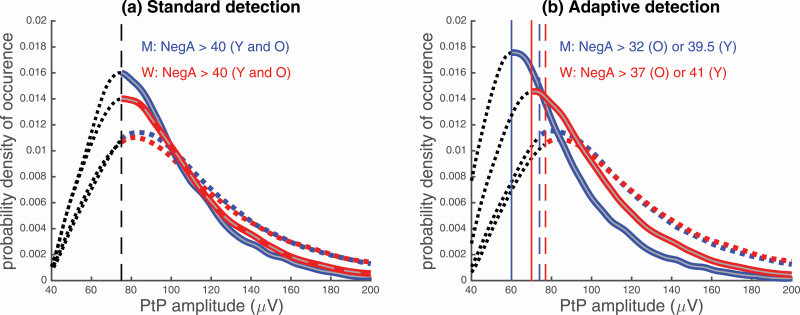
Figure 5.
Probability of occurrence of sleep SW PtP amplitude in (A) younger and (B) older adults in the testing cohort. The probability distributions were calculated so that the probability of occurrence (on the y-axis) is equal to one. Hence, the area under the curve of the histograms conveniently normalized must be equal to one. Each graph contains the standard SW detection (dashed lines), and the adaptive SW detection that refers to the data-driven SW detection (full lines). The color blue refers to the men, and the color red is for women. Vertical lines indicate each group’s respective PtP amplitude detection criterion. Dashed black lines before the vertical lines represent the “noise” detections. NegA represents negative amplitude of the detected SW.

