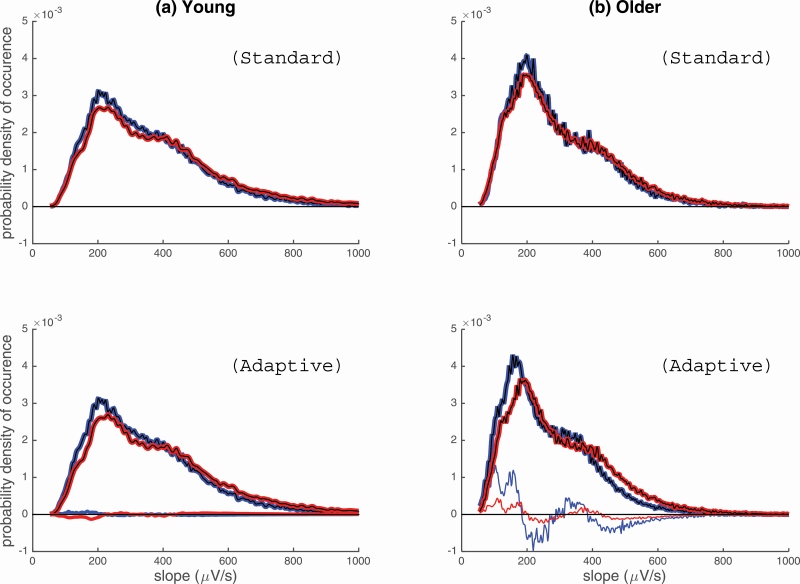
Figure 7.
Probability density of SW slope in (A) younger and (B) older adults, for women (red) and men (blue). The probability distributions were calculated so that the probability of occurrence (on the y-axis) is equal to one. Hence, the area under the curve of the histograms conveniently normalized must be equal to one. The standard SW detection is displayed in the first row, while the adaptive SW detection is displayed in the second row. For the graphs in the second row, thin lines exhibit the difference between the standard and adaptive distributions, for men and women.

