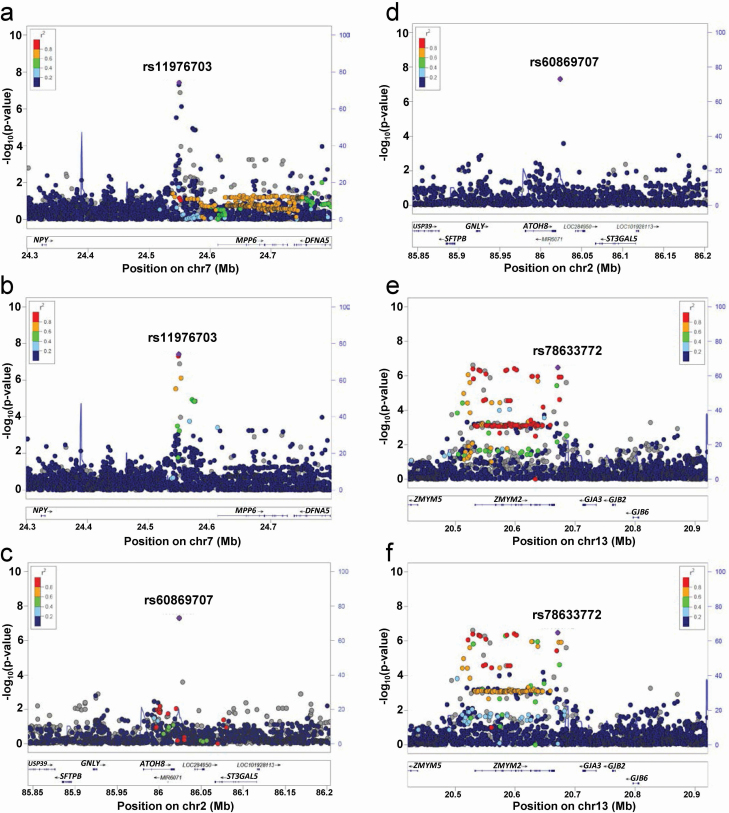
Figure 1.
Regional association plots of discovery GWAS for PSQI global score in OPPERA. (a–b) Regional association plots for genome-wide significant loci at chromosome 7 using EUR as a reference panel (a) and AFR panel (b). (c–d) Regional association plot at chromosome 2 using EUR as reference panel (c) and AFR panel (d). (e–f) Regional association plots for suggestive loci at chromosome 13 using EUR as reference panel (e) and AFR panel (f) Chromosomal position (Mb) is indicated on the x axis, and the –log10 p-value is indicated on the y axis. Each SNP is plotted as filled circle and the lead SNP is shown in purple. The genes within each region are shown in the lower panel. Recombination sites and rates are shown in blue. Additional SNPs in the locus are colored according to linkage disequilibrium (r2) with the lead SNP. rs78633772 instead of rs376585198 as the latter is not in the reference panel.

