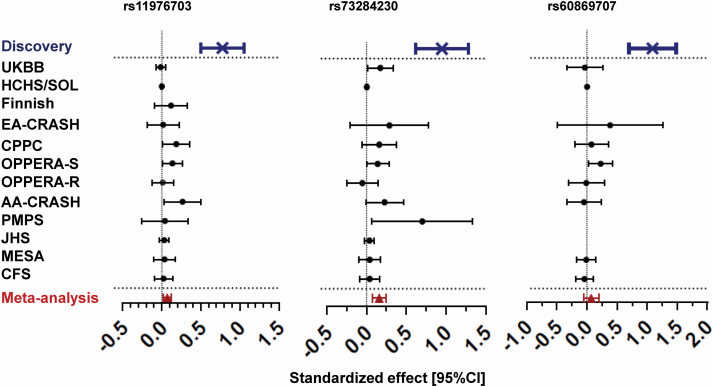
Figure 3.
Forest plots in meta-analysis. Forest plots of standardized effect size with 95% confidence interval for each replication study as well as for the fixed-effect meta-analysis for genome-wide significant SNPs. Higher effect sizes represent worse sleep quality. The discovery cohort was excluded from the meta-analysis calculation. The test of heterozygosity for each SNP was Q(df 11) = 16.29 p = 0.13 for rs11976703; Q(df 10) = 20.52 p = 0.03 for rs73284230 and Q(df 8) = 6.74 p = 0.57 for rs60869707. The sample sizes for the meta-analysis is 100659, 99931, and 96386 for rs11575542, rs73284230, and rs60869707, respectively.

