Figure S3.
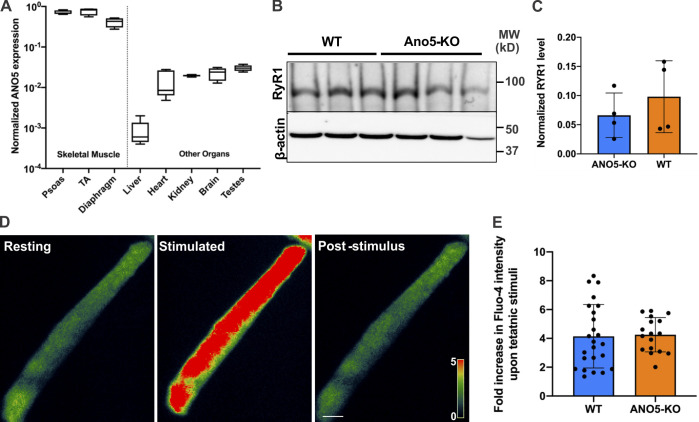
ANO5 expression and effect of its deficit on the ER Ca2+-handling machinery. (A) Quantitative PCR analysis of ANO5 mRNA expression in various mouse tissues. (B and C) Western blot showing a representative blot (B) and quantification (C) of RYR1 levels in tibialis anterior muscles from WT and ANO5-KO mice. (D and E) Pseudocolored images (D) and plot (E) showing an increase in FDB myofiber Ca2+ levels in WT and ANO5-KO mice using Fluo-4 dye. Plots show mean ± SD.

