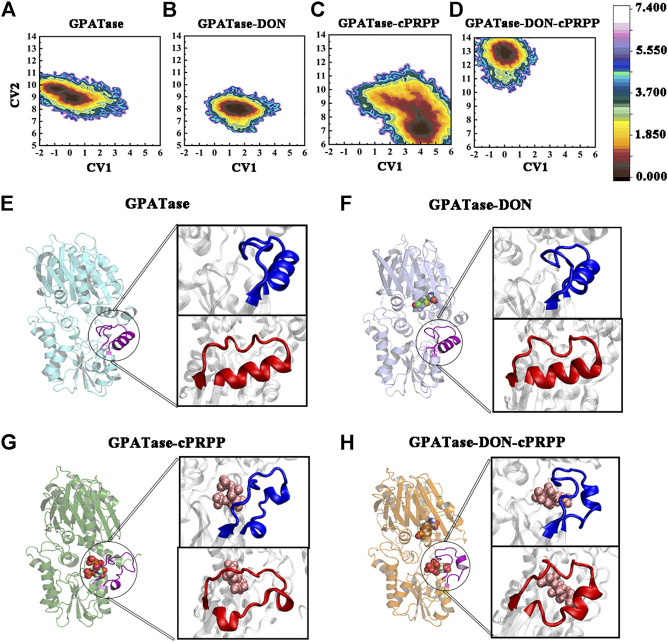
FIGURE 10.
The conformation change of PRTase flexible loops during 400 ns aMD simulations. Free energy profile maps of flexible loops for the (A) GPATase; (B) GPATase–DON; (C) GPATase–cPRPP; and (D) GPATase–DON–cPRPP complexes as a function of CV1 and CV2 in Å; representative structures of flexible loops for the (E) GPATase; (F) GPATase–DON; (G) GPATase–cPRPP; and (H) GPATase–DON-cPRPP complexes. The PRTase domain active site is shown in cartoon. Cartoons marked in blue and red represent different perspectives.

