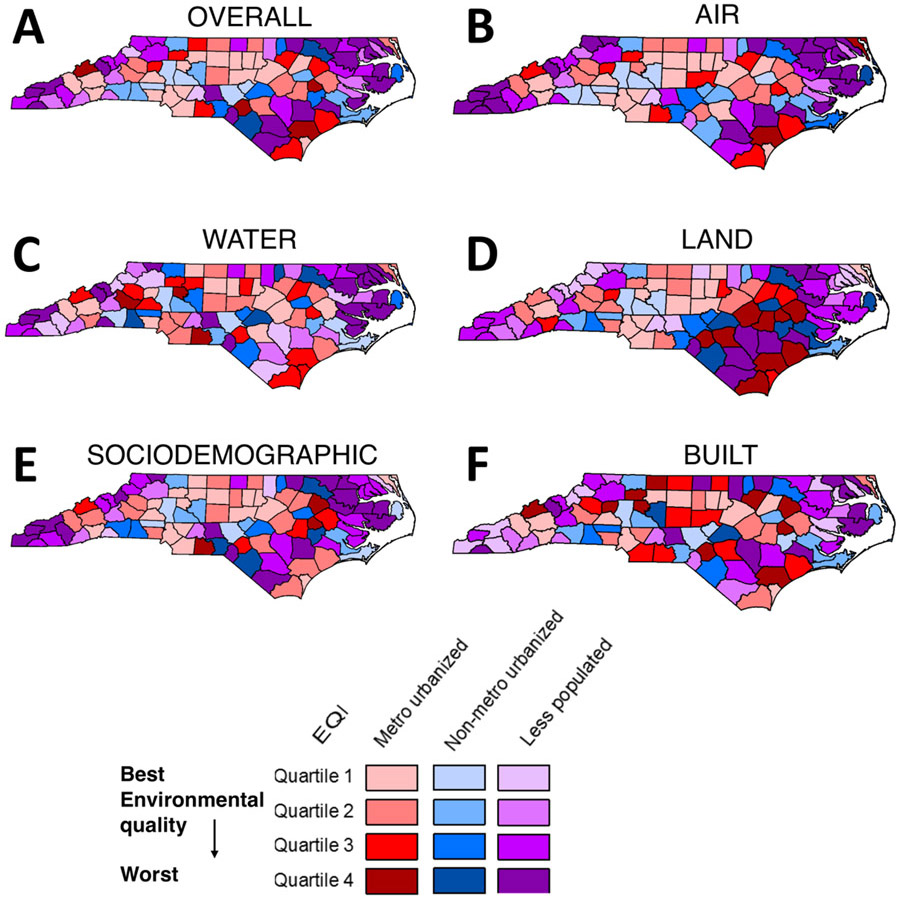
Figure 1. Environmental Quality Index Stratified by Rural-Urban Categories by County.
Quartiled Environmental Quality Index data by county and by rural-urban category for (A) total EQI and (B) air, (C) water, (D) land, (E) sociodemographic, and (F) built EQI domains. Maps recreated based on the EQI overview report [41].

