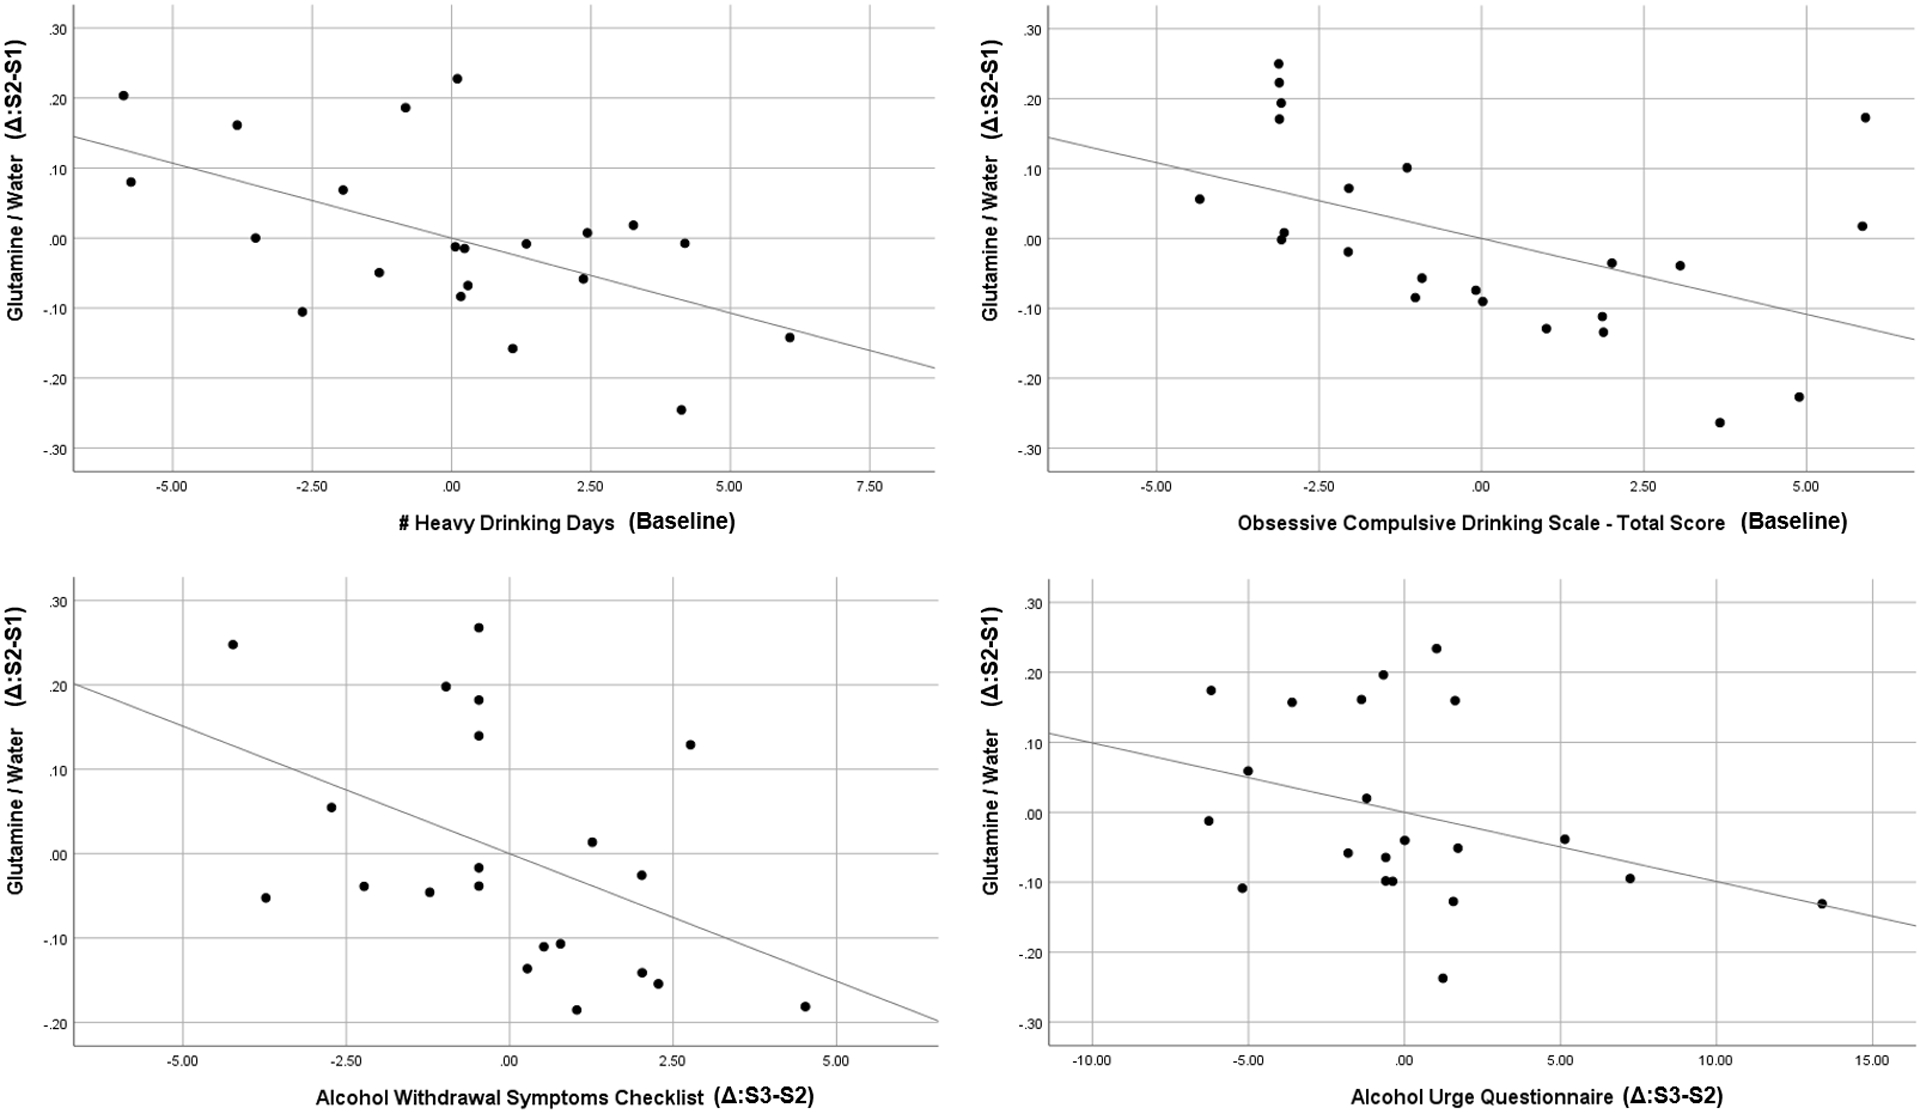
Figure 4.

Partial regression plots (i.e., controlling for temporally-preceding levels/scores) for associations between changes in glutamine/water levels between scans 1 and 2 (y-axis, all panels) and a) number of heavy drinking days preceding baseline (top left panel), b) Obsessive Compulsive Drinking Scale total scores at baseline (top right panel), c) changes in Alcohol Withdrawal Symptoms Checklist scores between scans 2 and 3 (bottom left panel), and d) changes in Alcohol Urge Questionnaire scores between scans 2 and 3 (bottom right panel).
